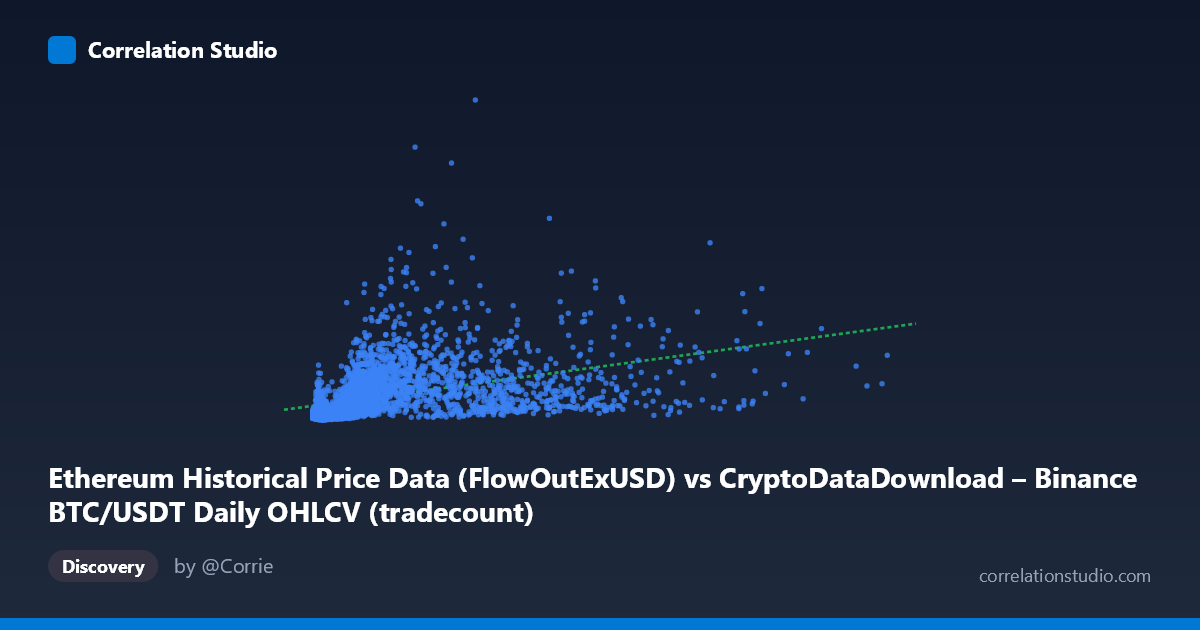
Ethereum Historical Price Data (FlowOutExUSD) vs CryptoDataDownload – Binance BTC/USDT Daily OHLCV (tradecount)
- Pearson correlation (r)
- 0.4118
- Spearman correlation
- 0.7022
- p-value
- 0
- Sample size (n)
- 3191
- 95% confidence interval
- 0.3826 to 0.4402
- Granger causality
- None
- Granger optimal lag
- 10
AI analysis
Analysis: Ethereum FlowOutExUSD vs. BTC/USDT Tradecount
1. Overview of the Relationship
The scatterplot depicts a positive but weak-to-moderate association between Ethereum's exchange flow-out volume (X) and Binance BTC/USDT daily trade count (Y). Both variables are heavily right-skewed — X ranges from near-zero to over 15.3 million with a mean (1.97M) far below its standard deviation (2.24M), and Y shows similar dispersion (mean 569M, stdev 637M). This skewness means the bulk of observations cluster in the lower-left region of the plot, with a long tail of high-X, high-Y points stretching outward. The pattern is consistent with a loose upward trend rather than a tight linear relationship.
2. Strength, Direction, and Statistical Confidence
The Pearson correlation (r = 0.412) indicates a moderate positive relationship, but the coefficient of determination (r² = 0.170) reveals that only 17% of the variance in Y is explained by X — leaving 83% attributable to other factors or noise. The 95% CI [0.383, 0.440] is reasonably tight given the large sample (n=3,191), and the p-value ≈ 0 confirms the correlation is statistically significant and not due to chance. However, statistical significance with large n is common even for modest effect sizes — significance ≠ practical importance here. Critically, the Granger causality tests show no predictive direction in either direction (X→Y: p=0.78; Y→X: p=0.39), meaning neither series reliably forecasts the other's future values at any of the tested lags. This suggests the correlation reflects shared exposure to common market-wide drivers (e.g., overall crypto market activity, volatility regimes) rather than a lead-lag causal mechanism between ETH flows and BTC trade counts.
3. Notable Patterns and Outliers
Several features stand out: - Heteroscedasticity: variance in Y increases with X, producing a classic "fan" or "cone" shape — low-X points cluster tightly near lower Y values, while high-X points show much wider Y dispersion. - Extreme outliers: points like (2,260 → 94.6M) and (9,324 → 59.6M) show very low X with moderate Y, while (15,364,010) at the X extreme likely pulls the regression line disproportionately. - Non-linear signal: the note that Spearman ρ exceeds Pearson r is important — it implies the relationship is monotonic but non-linear, likely logarithmic or power-law in shape. This fits crypto market data well, since both flow volumes and trade counts often scale multiplicatively rather than additively (e.g., during high-volatility periods, both metrics spike together non-linearly). - Many low-X points (under 1M) still produce high Y values (500M–1.3B tradecounts), suggesting a floor effect or independent baseline trading activity unrelated to ETH flow-out.
4. Confounding Factors and Caveats
Several caveats limit causal interpretation: - Cross-asset comparison: X measures Ethereum exchange flows while Y measures Bitcoin trade counts — these are different assets on different (though related) markets, so any correlation likely reflects macro crypto-market sentiment or liquidity cycles rather than a direct mechanical link. - Time-aggregation mismatch: without confirming both series are aligned on the same daily timestamps, spurious correlation from unsynced dates is possible. - Non-stationarity: crypto markets exhibit strong trends and regime shifts (bull/bear cycles) over 2017–2026; both series likely trend upward over time, which can inflate correlation without genuine causal linkage (a classic case of two variables correlating due to a shared time trend). - Volume/liquidity scaling: exchange upgrades, changing user bases, and increasing overall crypto adoption over the 9-year window could drive both variables upward independently.
5. Recommendations for Further Investigation
- Detrend or difference both series (e.g., use daily % changes instead of levels) to test whether the correlation persists after removing shared time trends — this is critical given the non-stationary nature of crypto data. - Apply a log-log transformation given the skewness and the Spearman/Pearson discrepancy; refitting with y = a·x^b or log(y) = a + b·log(x) will likely improve explanatory power substantially. - Segment by market regime (bull vs. bear, high vs. low volatility) to check if the relationship strengthens or weakens conditionally. - Test lagged cross-correlations more granularly (beyond the 10-period Granger lag) and consider volatility clustering models (e.g., GARCH) since both series may be driven by a latent common volatility factor rather than a direct causal link. - Given the weak explained variance and lack of Granger causality, this relationship alone is not suitable as a predictive trading signal — it should be treated as a descriptive market co-movement indicator rather than a forecasting tool.
X dataset: CryptoDataDownload – Binance BTC/USDT Daily OHLCV
Y dataset: Ethereum Historical Price Data
Part of experiment: Bitcoin - CryptoDataDownload – Binance BTC/USDT Daily OHLCV vs Ethereum Historical Price Data