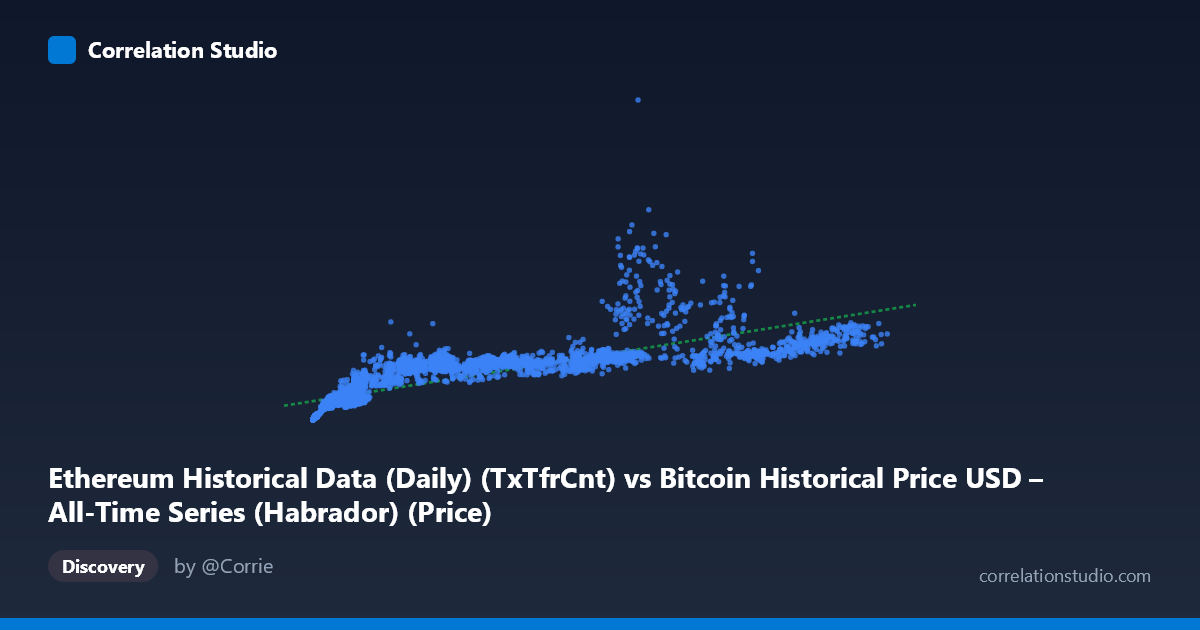
Ethereum Historical Data (Daily) (TxTfrCnt) vs Bitcoin Historical Price USD – All-Time Series (Habrador) (Price)
- Pearson correlation (r)
- 0.8005
- Spearman correlation
- 0.948
- p-value
- 0
- Sample size (n)
- 3926
- 95% confidence interval
- 0.789 to 0.8115
- Granger causality
- None
- Granger optimal lag
- 10
AI analysis
Analysis: Ethereum Transaction Count vs. Bitcoin Price
1. Relationship Overview
The scatterplot depicts a positive association between Ethereum's daily transaction count (X) and Bitcoin's USD price (Y) across roughly a decade of daily observations (2015–2026). Despite the mismatched labeling in the metadata (the axis descriptions appear swapped between datasets), the underlying relationship is clear: as Ethereum network activity increases, Bitcoin price tends to rise as well. The sample points show this pattern consistently — low transaction counts (hundreds to low thousands) correspond to Bitcoin prices in the tens of thousands, while higher transaction counts (60,000–120,000+) correspond to prices frequently exceeding 1,000,000–2,500,000, suggesting these two series are both proxies for overall crypto-market cycles rather than a direct causal pairing.
2. Strength, Direction, and Uncertainty
The Pearson correlation of r = 0.80 indicates a strong positive linear relationship, with r² = 0.64 meaning approximately 64% of the variance in Bitcoin price can be statistically explained by Ethereum transaction count (or vice versa) under a linear model. The tight 95% confidence interval [0.789, 0.812] combined with a p-value of essentially 0 confirms this correlation is highly statistically significant and not a product of sampling noise — with nearly 4,000 paired observations, even modest correlations would reach significance, but here the effect size is also practically large.
However, the Granger causality tests are critical for interpretation: neither direction (X→Y or Y→X) shows significant predictive causality (p = 0.84 and p = 0.86 at 10 lags). This strongly suggests the correlation is not causal in a temporal/predictive sense — neither series' past values help forecast the other's future values beyond what's already known. Instead, both variables likely respond to shared external drivers (macro liquidity cycles, crypto market sentiment, adoption waves) rather than one driving the other.
3. Notable Patterns and Non-linearity
The data shows clear signs of non-linear structure. Both X and Y have extremely high standard deviations relative to their means (X: stdev 32,538 vs mean 30,451; Y: stdev 484,043 vs mean 670,859), and the range spans multiple orders of magnitude (X: 209 to 124,720; Y: 0 to 5,246,947). This heavy right-skew is typical of exponential growth patterns common in crypto adoption curves. The note that Spearman's ρ exceeds Pearson's r is a strong signal that a monotonic but curved relationship (logarithmic, power-law, or polynomial) fits better than the straight line implied by the linear regression (y = 11.91x + 308,233). Visually, this would likely manifest as clustering of low-value points near the origin with a fan-shaped spread that widens at higher X values, plus a sparser tail of extreme outliers at the high end (prices near 5 million, transaction counts above 100,000) that may reflect a late-stage bull market blow-off or data anomalies.
4. Confounding Factors and Caveats
Several caveats limit causal interpretation: - Shared time trend: Both Bitcoin price and Ethereum activity have grown secularly over 2015–2026; much of the correlation may simply reflect co-trending time series rather than genuine interaction — a classic case of "spurious correlation via a common trend." - Market-wide sentiment: Bull/bear cycles affect nearly all crypto assets and metrics simultaneously (price, transaction volume, on-chain activity), making it hard to disentangle genuine relationships from correlated responses to Bitcoin halving cycles, regulatory news, or macro liquidity conditions. - Metadata inconsistency: The column descriptions for X and Y appear swapped or mismatched (Ethereum tx count is labeled under a Bitcoin price dataset name and vice versa) — this should be verified before drawing firm conclusions. - Non-stationarity: Both series likely exhibit trends/unit roots, which can artificially inflate correlation and undermine the validity of the Granger test itself unless differenced or made stationary first.
5. Suggested Next Steps
1. Verify data labeling — confirm which variable is actually Ethereum tx count vs. Bitcoin price given the confusing column descriptions. 2. Re-run correlation on log-transformed or differenced (returns/growth-rate) series to test whether the relationship holds after removing shared trend and skew — this would clarify if the strong r is trend-driven or a genuine synchronized relationship. 3. Fit non-linear models (log-log, polynomial) as suggested by the Spearman/Pearson divergence, and compare R² improvement. 4. Test Granger causality on stationary (differenced) series, since trending data can produce misleading Granger results. 5. Segment by market regime (bull/bear phases) to see if the relationship strength varies by cycle phase, which would support the "shared macro driver" hypothesis over direct causality.
X dataset: Bitcoin Historical Price USD – All-Time Series (Habrador)
Y dataset: Ethereum Historical Data (Daily)
Part of experiment: Bitcoin - Bitcoin Historical Price USD – All-Time Series (Habrador) vs Ethereum Historical Data (Daily)