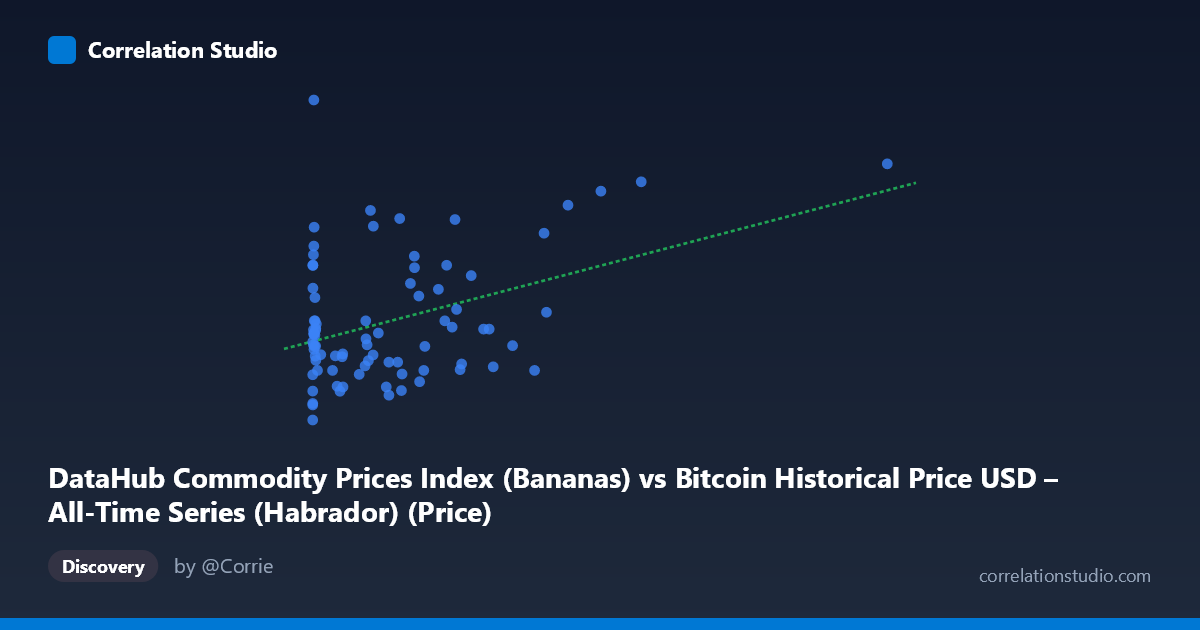
DataHub Commodity Prices Index (Bananas) vs Bitcoin Historical Price USD – All-Time Series (Habrador) (Price)
- Pearson correlation (r)
- 0.4009
- Spearman correlation
- 0.2138
- p-value
- 0.000173
- Sample size (n)
- 83
- 95% confidence interval
- 0.2027 to 0.5675
- Granger causality
- None
- Granger optimal lag
- 10
AI analysis
Analysis: Bitcoin Price Index vs. Bananas Commodity Price Index
1. What the Visualization Reveals
The scatterplot displays a positive but noisy relationship between the "Bananas" commodity index (X) and Bitcoin's historical USD price (Y). Most data points cluster tightly in the lower-left region (X < 500, Y between 900–1050), reflecting Bitcoin's early history when prices were low and stable. A smaller number of points extend rightward toward higher X values (up to 2452), corresponding to later periods when Bitcoin's price rose substantially (up to 1151). The overall shape suggests a weak upward trend rather than a tight linear relationship.
2. Strength, Direction, and Statistical Confidence
The correlation coefficient (r = 0.40) indicates a weak-to-moderate positive relationship. Critically, r² = 0.161 means only 16% of the variance in Bitcoin price is explained by the Bananas index — the remaining 84% is driven by other factors. The 95% confidence interval [0.20, 0.57] is fairly wide, reflecting the modest sample size (n=83) and reinforcing that the true relationship could be anywhere from weak to moderately strong. However, the p-value (0.00017) confirms this correlation is statistically significant — unlikely to be due to chance alone. That said, statistical significance ≠ practical significance: with only 16% variance explained, this relationship has limited predictive power. The Granger causality tests further weaken any causal narrative: neither direction (X→Y or Y→X) shows significant predictive causality (p = 0.41 and p = 0.91 respectively), meaning past values of one series do not meaningfully help forecast future values of the other, even at the optimal lag of 10 periods.
3. Notable Patterns and Outliers
The data shows a dense cluster near the origin (X < 50) with substantial Y-axis spread (883–1151), indicating high variability in Bitcoin price even when the Bananas index is near zero — this is likely an artifact of early Bitcoin price volatility rather than a true relationship with commodities. Sparse, high-leverage points at large X values (997, 1230, 1402, 2452) appear to disproportionately drive the positive slope; without these few points, the correlation could weaken substantially. There's no clear evidence of a strong linear or non-linear pattern — rather, the relationship resembles two loosely connected regimes (a low-X noisy cluster and a handful of high-X outliers pulling the trend upward).
4. Confounding Factors and Caveats
This is a classic case of spurious correlation risk in time-series data. Both variables likely share a common confound: time itself. Bitcoin price has a well-known secular upward trend from 2010–2017, and if the Bananas commodity index also trended (even independently) over this same period, the two series would appear correlated without any causal or economic link. Commodity indices and Bitcoin prices operate in fundamentally different markets (agricultural trade vs. speculative crypto assets), making a genuine economic relationship implausible. The lack of Granger causality in either direction supports this — it suggests the correlation is driven by co-incidental trending rather than any lead-lag economic mechanism.
5. Suggested Next Steps
To determine if this correlation is meaningful or spurious: (1) detrend both series (e.g., using differencing or removing time trends) and recompute correlation on the residuals; (2) test for cointegration rather than simple correlation, given both are time series; (3) examine whether the high-leverage outliers (X 1000) disproportionately drive the r value via a leave-one-out sensitivity analysis; (4) consider that "Bananas" as a proxy variable is economically arbitrary here — this pairing may simply be a demonstration of how unrelated time series can show misleading correlations. Given the weak r², non-significant Granger causality, and lack of economic rationale, this relationship should not be used for forecasting or trading strategies without much stronger causal evidence.
X dataset: Bitcoin Historical Price USD – All-Time Series (Habrador)
Y dataset: DataHub Commodity Prices Index
Part of experiment: Bitcoin - Bitcoin Historical Price USD – All-Time Series (Habrador) vs DataHub Commodity Prices Index