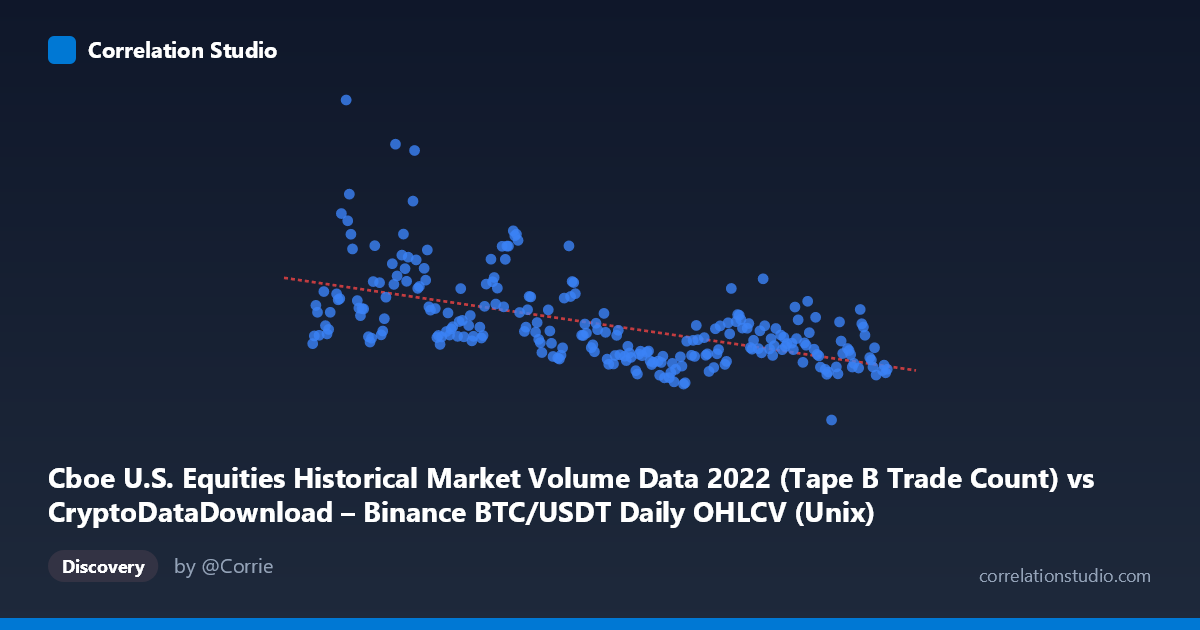
Cboe U.S. Equities Historical Market Volume Data 2022 (Tape B Trade Count) vs CryptoDataDownload – Binance BTC/USDT Daily OHLCV (Unix)
- Pearson correlation (r)
- -0.5632
- Spearman correlation
- -0.6029
- p-value
- 0
- Sample size (n)
- 251
- 95% confidence interval
- -0.6422 to -0.4723
- Granger causality
- None
- Granger optimal lag
- 10
- Time coverage
- 2022-01-03 to 2022-12-30
AI analysis
Analysis: BTC/USDT Volume vs. Cboe Equities Trade Count (2022)
1. What the Visualization Reveals
The scatterplot shows a moderate negative relationship between the X variable (labeled as Cboe trade count but populated with timestamp-scale values in the billions, suggesting a likely column-mapping issue) and Y (labeled as BTC/USDT data but showing volume-like magnitudes ranging ~170K–1.4M). Despite the apparent metadata mismatch, treating the axes as given, points trend downward as X increases — early-2022 dates cluster with higher Y values, while later-2022 dates cluster with lower Y values. This is consistent with a time-based decay pattern rather than a direct causal economic relationship between two independent market metrics.
2. Strength, Direction, and Statistical Confidence
The correlation coefficient (r = -0.563) indicates a moderate negative relationship, with r² = 0.317 meaning only about 32% of the variance in Y is explained by X — leaving roughly two-thirds of Y's variability unexplained by this linear relationship. The 95% CI [-0.642, -0.472] is reasonably tight and excludes zero, and the p-value ≈ 0 confirms this correlation is statistically significant and not due to chance, given n=251. However, statistical significance here reflects a real but partial association, not a strong predictive relationship — r² of 0.32 means an r² this size still leaves substantial scatter, as visible in the chart.
Critically, the Granger causality tests show no significant predictive direction in either direction (X→Y: p=0.21; Y→X: p=0.30). This means neither variable's past values help forecast the other's future values in a time-series sense, despite the contemporaneous correlation. This is an important distinction: the two series move together somewhat at the same point in time, but neither leads nor lags the other in a predictively useful way.
3. Notable Patterns and Outliers
Several high-Y outliers stand out early in the series (e.g., ~1.21M and ~968K around Jan–Feb 2022), coinciding with the earliest X timestamps — consistent with a broader "high volume/volatility at year start, declining through year end" pattern typical of BTC's 2022 bear market. The data appears to decay somewhat exponentially or in a stepped fashion rather than strictly linearly, with a cluster of lower, more stable Y values (300K–550K) dominating the back half of the year. This suggests the "correlation" may largely be an artifact of both series trending over calendar time (X is literally a timestamp) rather than a meaningful economic relationship — a classic spurious correlation via shared time trend.
4. Confounding Factors and Caveats
The most significant caveat: X appears to be a raw Unix timestamp (per the range in the data summary, 1.64–1.67 trillion, matching millisecond epoch time), not an actual trade-count metric — the column labels appear to be swapped or mismatched with the described datasets. If X is simply "date," the negative correlation likely reflects nothing more than BTC volume declining over the course of 2022 (a well-known trend during that bear market), not any real link to Cboe equities activity. Even if the labels are correct, cross-market comparisons like this risk confounding by macro factors — Fed rate hikes, risk-off sentiment, and declining volatility affected both crypto and equities volumes simultaneously in 2022, inflating correlation without direct causation.
5. Recommendations for Further Investigation
Before drawing conclusions, verify the axis/column mapping to confirm X and Y are correctly assigned to their intended datasets. If confirmed, de-trend both series (e.g., using differencing or removing the calendar-time component) and re-test correlation on residuals to rule out spurious trend-driven correlation. Given the null Granger causality result, any claims of predictive relationship should be avoided — treat this as a contemporaneous association at best. Further, consider examining segment-specific correlations (e.g., pre/post major market events like the Terra/Luna or FTX collapses) and controlling for known confounders like overall market volatility (VIX) or macro liquidity conditions.
X dataset: CryptoDataDownload – Binance BTC/USDT Daily OHLCV
Y dataset: Cboe U.S. Equities Historical Market Volume Data 2022
Part of experiment: Bitcoin - CryptoDataDownload – Binance BTC/USDT Daily OHLCV vs Cboe U.S. Equities Historical Market Volume Data 2022