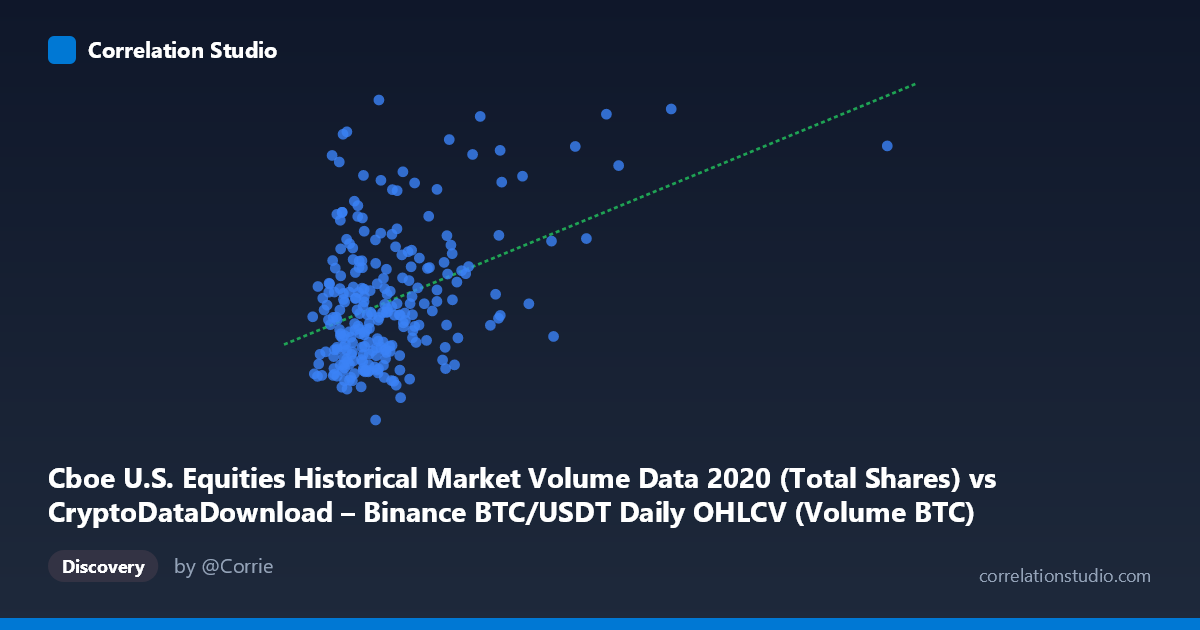
Cboe U.S. Equities Historical Market Volume Data 2020 (Total Shares) vs CryptoDataDownload – Binance BTC/USDT Daily OHLCV (Volume BTC)
- Pearson correlation (r)
- 0.4095
- Spearman correlation
- 0.2653
- p-value
- 0
- Sample size (n)
- 253
- 95% confidence interval
- 0.3014 to 0.5072
- Granger causality
- None
- Granger optimal lag
- 10
- Time coverage
- 2020-01-02 to 2020-12-31
AI analysis
Analysis: Cboe U.S. Equities Volume vs. Binance BTC/USDT Volume (2020)
1. Relationship Overview
The scatterplot depicts a weak-to-moderate positive relationship between U.S. equities market volume (X) and Binance BTC/USDT trading volume (Y) across 253 paired daily observations in 2020. The data shows substantial scatter around the fitted regression line (y = 1743.87x + 5.206E+08), with points spread widely across the Y-axis even at similar X values — indicating that equities volume alone captures only a modest portion of the variation in crypto trading volume.
2. Strength, Direction, and Statistical Confidence
The Pearson correlation of r = 0.4095 indicates a positive but modest linear association. Critically, r² = 0.1677 means only ~16.8% of the variance in Bitcoin trading volume is statistically explained by equities volume — leaving roughly 83% attributable to other factors (crypto-specific volatility events, sentiment, exchange dynamics, etc.). The 95% CI [0.301, 0.507] is reasonably tight and excludes zero, and the p-value (1.2×10⁻¹¹) confirms the correlation is highly statistically significant — this is a real, non-random association, not strong enough to be practically predictive on its own.
Importantly, the Granger causality test shows no significant predictive direction in either direction (X→Y: p=0.69; Y→X: p=0.34) even at an optimal lag of 10 periods. This is a crucial caveat: despite the contemporaneous correlation, neither market's volume helps forecast the other's future values. The relationship appears to be a coincident association rather than a lead-lag or causal linkage — both series may be responding to shared macro conditions (e.g., pandemic-driven volatility in Q1 2020) rather than one market driving the other.
3. Notable Patterns and Outliers
Several data points stand out: - (71155.21, 1,209,821,340.56) — an extreme Y-outlier where BTC volume nearly doubles the mean despite unremarkable equities volume, likely corresponding to a high-volatility crypto event (possibly the March 2020 COVID crash or a specific news-driven spike). - (402201.67, 1,083,464,297.31) — the maximum X value paired with high Y, but this single point sits far from the rest of the X distribution (mean 76,783, stdev 41,609), making it a high-leverage point that could disproportionately influence the regression slope. - A cluster of points with X in the 40,000–80,000 range shows Y ranging from ~440M to over 1.1B, illustrating that low-to-moderate equities volume days are compatible with vastly different crypto volumes — reinforcing the weak explanatory power.
No strong non-linear curvature is evident; the relationship appears roughly linear but with high residual variance (heteroscedasticity is plausible, with wider Y-spread at lower X values).
4. Confounding Factors and Caveats
- 2020 as an anomalous year: COVID-19 market shocks (March 2020) likely drove simultaneous volume spikes in both equities and crypto markets, creating spurious correlation via a shared external shock rather than genuine market linkage. - Different market structures: Equities volume (shares) and crypto volume (BTC units) are not directly comparable units; scaling/normalization effects could distort correlation strength. - The high-leverage outlier (X=402,201) may be inflating or deflating the r² and slope estimates — a sensitivity check (e.g., removing this point) is warranted. - Autocorrelation: Both time series likely have internal trends/autocorrelation (volume clustering) that can inflate apparent correlation between unrelated series (spurious regression risk in time series data). - Sample vs. population: n=253 sampled from N=3,212, so results should be interpreted as representative but not exhaustive of the full population relationship.
5. Actionable Insights and Further Investigation
- Do not use equities volume as a predictive feature for Bitcoin volume in forecasting models — the lack of Granger causality confirms no temporal edge, despite the contemporaneous correlation. - Investigate the shared macro driver hypothesis: overlay both series with a volatility index (e.g., VIX) or major 2020 news events (COVID crash, stimulus announcements) to test if a third variable explains the correlation. - Sensitivity analysis: Re-run correlation/regression excluding the X=402,201 outlier to check robustness of r² and slope. - Detrend or difference both series before correlation analysis to rule out spurious correlation from shared trends, then re-test Granger causality on the detrended series. - Explore non-linear or regime-based models (e.g., separate analysis for high-volatility vs. calm periods) since the relationship may only hold during specific market stress windows rather than uniformly across the year.
X dataset: CryptoDataDownload – Binance BTC/USDT Daily OHLCV
Y dataset: Cboe U.S. Equities Historical Market Volume Data 2020
Part of experiment: Bitcoin - CryptoDataDownload – Binance BTC/USDT Daily OHLCV vs Cboe U.S. Equities Historical Market Volume Data 2020