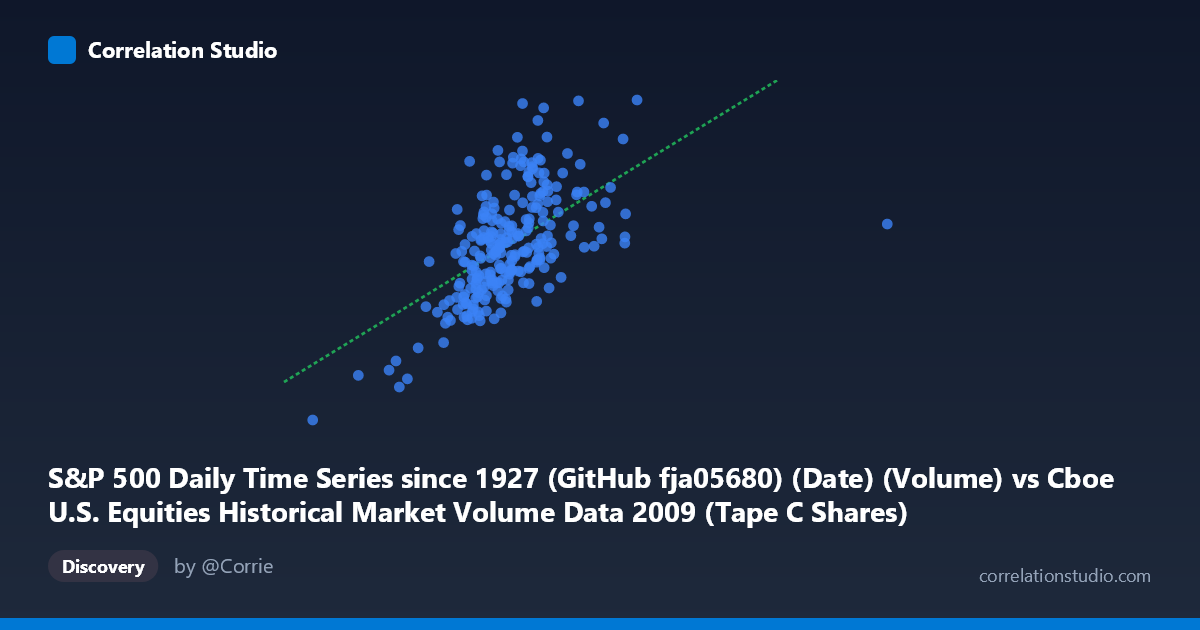
S&P 500 Daily Time Series since 1927 (GitHub fja05680) (Date) (Volume) vs Cboe U.S. Equities Historical Market Volume Data 2009 (Tape C Shares)
- Pearson correlation (r)
- 0.574
- Spearman correlation
- 0.6039
- p-value
- 0
- Sample size (n)
- 252
- 95% confidence interval
- 0.4849 to 0.6514
- Granger causality
- X → Y
- Granger optimal lag
- 10
AI analysis
Analysis: S&P 500 Volume vs. Cboe Tape C Shares (2009)
Relationship Overview The scatterplot reveals a moderate positive relationship between S&P 500 daily trading volume (X-axis) and Cboe Tape C share volume (Y-axis) across 252 trading days in 2009. As total S&P 500 market volume increases, Tape C shares traded on Cboe tend to rise correspondingly. The linear regression equation (y = 24.22x + 1.353B) suggests that for every additional unit of S&P 500 volume, Tape C shares increase by approximately 24 shares, though the relationship is clearly imperfect with substantial scatter around the regression line. This makes intuitive sense — broader market activity naturally lifts exchange-specific volume, but Cboe's Tape C segment is influenced by its own structural and competitive dynamics.
Correlation Strength and Statistical Significance The correlation of r = 0.574 indicates a moderate positive association, but the more telling figure is r² = 0.3295, meaning only about 33% of the variance in Tape C shares is explained by total S&P 500 volume. The remaining ~67% is attributable to other factors entirely. The 95% confidence interval of [0.485, 0.651] is reasonably tight and excludes zero comfortably, and the p-value of effectively zero confirms this is not a chance finding given a sample of n = 252 from a population of N = 3,232. Critically, Granger causality analysis confirms a unidirectional temporal relationship: S&P 500 volume predicts future Tape C volume (F = 2.25, p = 0.016) with an optimal lag of 10 trading periods (~2 weeks), while the reverse direction is statistically insignificant (F = 0.91, p = 0.527). This suggests that broad market volume leadership precedes Cboe-specific activity rather than vice versa.
Notable Patterns, Clusters, and Outliers Several features stand out visually. The bulk of observations cluster in a moderately dense central band roughly between 150M–210M on X and 4B–7.5B on Y, suggesting typical 2009 trading conditions. However, there are notable outliers that deserve attention: one point at approximately (52.7M, 1.27B) sits far to the lower left — likely an early January 2009 holiday-shortened or anomalous session — and another at roughly (253.8M, 9.12B) at the upper extreme, possibly coinciding with a high-volatility event during the post-financial-crisis period. A cluster of points in the upper-right (200M–250M X range, 7B–9B Y range) hints at elevated volatility episodes in early 2009 when market stress was highest. The scatter also widens at higher volume levels, suggesting heteroscedasticity — the relationship becomes less predictable during high-activity periods.
Confounding Factors and Caveats Several important caveats apply. 2009 was a structurally unique year: markets were recovering from the 2008 financial crisis, with volatility (VIX) at historically elevated levels, meaning volume patterns were driven heavily by fear and deleveraging rather than normal price-discovery mechanisms. The Granger causality lag of 10 periods may partly reflect institutional rebalancing cycles or derivative-related flows rather than a stable causal mechanism. Additionally, Tape C specifically captures NASDAQ-listed securities traded on Cboe venues, so its volume is also sensitive to Cboe's own market share battles with NYSE Arca and other venues — a competitive dynamic completely unrelated to aggregate S&P 500 volume. The dataset mismatch (one series originates from GitHub/Yahoo Finance, the other from Cboe directly) introduces potential measurement and timing alignment issues.
Actionable Insights and Further Investigation Given the Granger causality finding, practitioners could explore whether the 10-day lag in S&P 500 volume predicting Tape C activity holds outside of 2009 crisis conditions — if persistent, it may offer a useful leading indicator for exchange-specific liquidity planning. Further investigation should decompose Tape C volume by market condition regime (high-VIX vs. low-VIX periods) to test whether the correlation strengthens during stress events. Incorporating additional explanatory variables — such as VIX levels, Fed policy announcements, or Cboe market share data — into a multivariate model would likely push r² substantially above the current 33%, providing a more complete picture. Finally, replicating this analysis across multiple years (2010–2020) would help distinguish crisis-period artifacts from durable structural relationships.
X dataset: Cboe U.S. Equities Historical Market Volume Data 2009
Y dataset: S&P 500 Daily Time Series since 1927 (GitHub fja05680) (Date)
Part of experiment: Daily - Cboe U.S. Equities Historical Market Volume Data 2009 vs S&P 500 Daily Time Series since 1927 (GitHub fja05680) (Date)