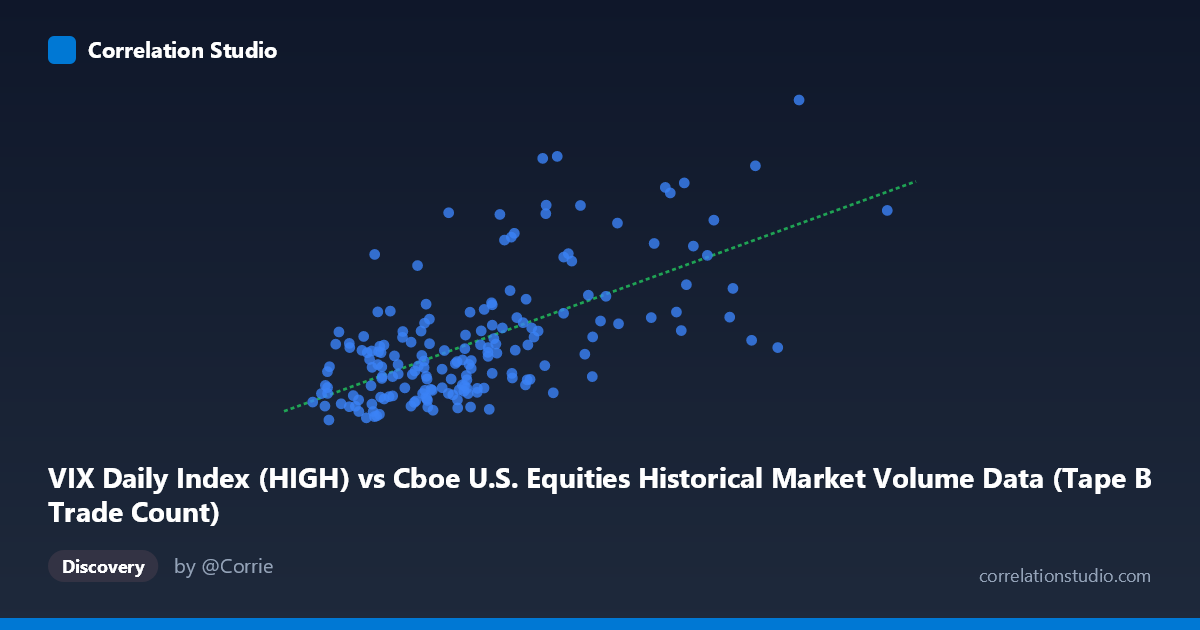
VIX Daily Index (HIGH) vs Cboe U.S. Equities Historical Market Volume Data (Tape B Trade Count)
- Pearson correlation (r)
- 0.6334
- Spearman correlation
- 0.5832
- p-value
- 0
- Sample size (n)
- 181
- 95% confidence interval
- 0.5372 to 0.7134
- Granger causality
- None
- Granger optimal lag
- 1
AI analysis
Scatterplot Analysis: VIX Daily Index (HIGH) vs. Tape B Trade Count
1. Overall Relationship The scatterplot reveals a moderate positive relationship between the VIX Daily Index High values and Tape B Trade Count, meaning that as VIX high readings increase, the volume of Tape B trades tends to rise as well. The linear regression equation (y = 1.03×10⁻⁵x + 10.93) confirms this upward trend, with higher volatility readings associated with greater equity trading activity on Tape B exchanges. This is conceptually intuitive: elevated market volatility typically drives increased investor activity, whether through hedging, panic selling, or opportunistic trading, all of which inflate trade counts.
2. Correlation Strength and Statistical Significance The Pearson correlation of r = 0.566 indicates a moderate positive association, but the coefficient of determination r² = 0.321 is the more telling statistic — it means that only 32.1% of the variance in Tape B Trade Count is explained by VIX High values, leaving roughly 68% attributable to other factors. The 95% confidence interval of [0.415, 0.687] is meaningfully wide, reflecting real uncertainty in the true population relationship despite the strong statistical significance (p = 1.0×10⁻⁹, N = 1,980). The low p-value confirms this is not a chance finding, but the modest r² tempers practical enthusiasm. Critically, the Granger causality tests show no significant predictive directionality in either direction (X→Y: F=0.37, p=0.54; Y→X: F≈0.00, p=0.999), meaning VIX High values do not temporally predict Tape B trade counts at a one-period lag, and vice versa. The relationship appears contemporaneous rather than predictive, limiting its utility for forecasting.
3. Notable Patterns, Clusters, and Outliers The data is not uniformly distributed. A dense cluster of points congregates in the lower-left region (VIX High roughly 650,000–1,050,000; Trade Count ~15–22), suggesting a "baseline" regime of moderate volatility and typical trading activity that characterizes the majority of the sample period. Above this cluster, the data thins considerably, with a notable high-leverage scatter of points extending toward the upper right. Several outliers deserve attention: the point near (1,623,470; 35.30) and (1,531,753; 31.04) sit well above the regression line, as do (1,115,472; 31.65) and (1,085,027; 31.52), which represent relatively moderate VIX readings paired with unusually high trade counts — suggesting idiosyncratic spikes not explained by volatility alone. Conversely, (1,808,758; 28.15) shows the highest VIX reading but a below-expectation trade count, hinting at non-linearity or saturation effects at extreme volatility.
4. Confounding Factors and Interpretive Caveats Several important caveats apply. First, the axes appear mislabeled or swapped in the source metadata — VIX values are typically small numbers (10–80), whereas the X-axis values range into the millions, suggesting the "VIX Daily Index (HIGH)" column may actually represent raw market volume data and vice versa, which warrants careful data verification before drawing conclusions. Second, time-varying market structure factors — such as options expiration cycles, earnings seasons, Federal Reserve announcements, and macroeconomic shocks — could simultaneously drive both volatility and trade counts, acting as common causes rather than one variable driving the other. Third, the 2026 date range (January–May) is a short, single-season window that may not represent typical cross-cycle behavior. Fourth, Tape B specifically covers NYSE American and regional exchanges, which may respond differently to volatility than broader market benchmarks.
5. Actionable Insights and Further Investigation Given the moderate but incomplete explanatory power, practitioners should not rely on VIX High alone as a predictor of Tape B trade activity. Instead, a multivariate model incorporating additional drivers — such as Tape A/C volumes, options market activity, or macroeconomic indicators — would likely improve predictive power substantially. It would be worth testing non-linear specifications (e.g., logarithmic or piecewise regression), given the apparent clustering and outlier behavior at extremes. The failed Granger causality test suggests any trading strategy based on lagged VIX signals to anticipate Tape B activity would lack foundation; instead, intraday or same-day concurrent analysis may be more appropriate. Finally, validating the dataset column assignments and extending the analysis to multi-year data would both strengthen confidence in the correlation and reveal whether this relationship is structurally stable across different volatility regimes.
X dataset: Cboe U.S. Equities Historical Market Volume Data
Y dataset: VIX Daily Index
Part of experiment: Daily - Cboe U.S. Equities Historical Market Volume Data vs VIX Daily Index