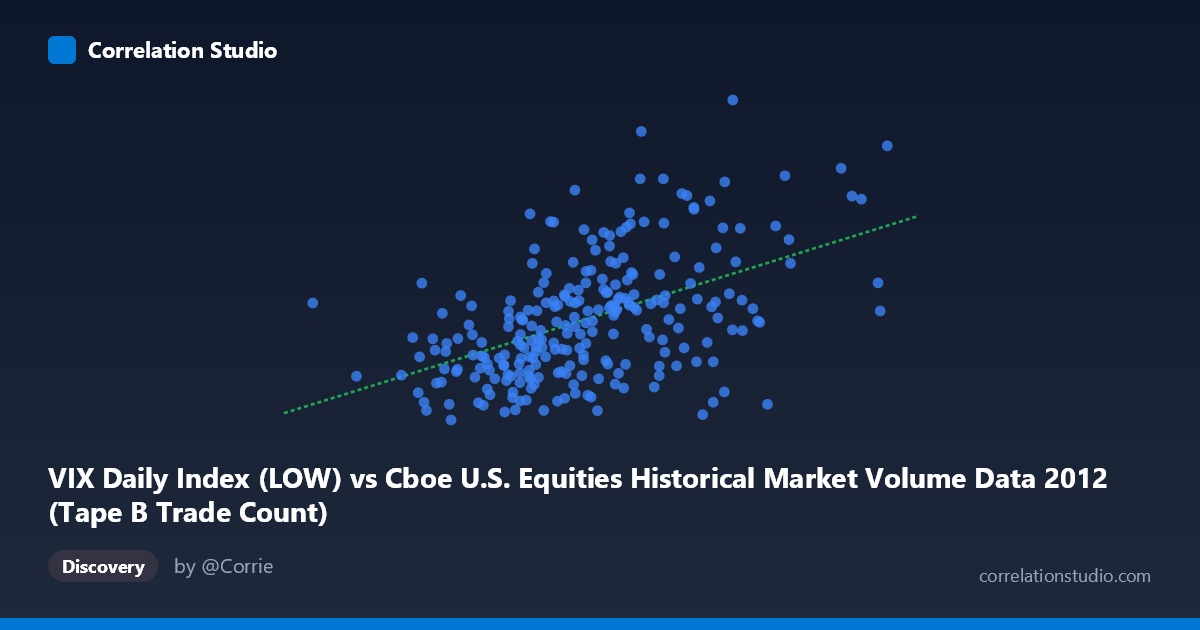
VIX Daily Index (LOW) vs Cboe U.S. Equities Historical Market Volume Data 2012 (Tape B Trade Count)
- Pearson correlation (r)
- 0.5002
- Spearman correlation
- 0.499
- p-value
- 0
- Sample size (n)
- 250
- 95% confidence interval
- 0.401 to 0.5878
- Granger causality
- None
- Granger optimal lag
- 1
AI analysis
Analysis: VIX Daily Index (LOW) vs. Tape B Trade Count (2012)
Relationship Overview The scatterplot reveals a moderate positive relationship between the VIX Daily Index Low values and the Cboe U.S. Equities Tape B Trade Count across 2012. As the VIX low values increase — indicating elevated baseline volatility — Tape B trade counts tend to rise as well. The linear regression equation (y = 2.95445E-05x + 12.0373) confirms this upward slope, suggesting that higher volatility floor levels are associated with greater trading activity on Tape B exchanges. However, the scatter around the regression line is visibly substantial, indicating that many data points deviate considerably from this trend.
Correlation Strength and Statistical Significance The Pearson correlation of r = 0.50 indicates a moderate positive association, but the explanatory power is notably limited: r² = 0.25 means only 25% of the variance in Tape B trade counts is explained by the VIX low values, leaving 75% attributable to other factors. The 95% confidence interval of [0.40, 0.59] is relatively tight given the large sample (N = 3,750), and the p-value of essentially zero confirms the relationship is statistically robust and not a chance finding. That said, statistical significance here is partly a function of the large population size — a moderate effect can appear highly significant with thousands of observations. Critically, Granger causality tests find no significant predictive directionality in either direction (X→Y: F = 1.79, p = 0.18; Y→X: F = 0.14, p = 0.71), meaning neither variable reliably forecasts the other with a one-period lag. This substantially tempers any causal interpretation.
Notable Patterns and Outliers The sample points reveal meaningful heterogeneity across the distribution. Several high-VIX observations (e.g., X ≈ 197,126 with Y = 22.66; X ≈ 206,588 with Y = 22.66; X ≈ 170,460 with Y = 22.22) cluster near the upper range of trade counts, consistent with the positive trend. However, there are notable outliers and contradictions: points like (295,122; 17.53) and (222,650; 13.51) show very high VIX lows paired with below-average or low trade counts, directly undermining the linear trend. Conversely, some lower-VIX observations show moderate-to-high trade counts. This suggests non-linear dynamics or regime-dependent behavior may be at play — the relationship may strengthen only during acute volatility spikes rather than holding uniformly across the range.
Confounding Factors and Caveats Several confounders warrant caution. First, market microstructure shifts in 2012 — such as exchange fee changes, order routing adjustments, or regulatory changes — could independently drive Tape B trade counts regardless of volatility. Second, day-of-week and seasonal effects in both trading volume and VIX are well-documented and could create spurious co-movement without causal linkage. Third, the X-axis variable is the VIX low (not close or average), which represents the daily volatility floor — a more specialized measure that may capture intraday calm periods rather than overall volatility sentiment, complicating interpretation. Finally, the absence of Granger causality suggests that any observed correlation may reflect common responses to shared external shocks (e.g., macro announcements, Fed events) rather than a direct mechanism between these two variables.
Actionable Insights and Further Investigation Despite the non-causal finding, the moderate correlation is practically meaningful for risk and volume modeling. Practitioners could explore whether the relationship strengthens when VIX crosses specific thresholds (e.g., VIX 20), suggesting a regime-switching or threshold regression approach would be more informative than a single linear model. It would also be valuable to incorporate additional Tape types (A and C) to determine whether this pattern is Tape B-specific or market-wide. Testing longer Granger lags (beyond one period) and including control variables such as S&P 500 returns, macroeconomic releases, or time-fixed effects would help isolate the true relationship. Finally, extending the analysis beyond 2012 would test whether this moderate correlation is a persistent structural feature of U.S. equity markets or an artifact of 2012's specific volatility regime.
X dataset: Cboe U.S. Equities Historical Market Volume Data 2012
Y dataset: VIX Daily Index
Part of experiment: Daily - Cboe U.S. Equities Historical Market Volume Data 2012 vs VIX Daily Index