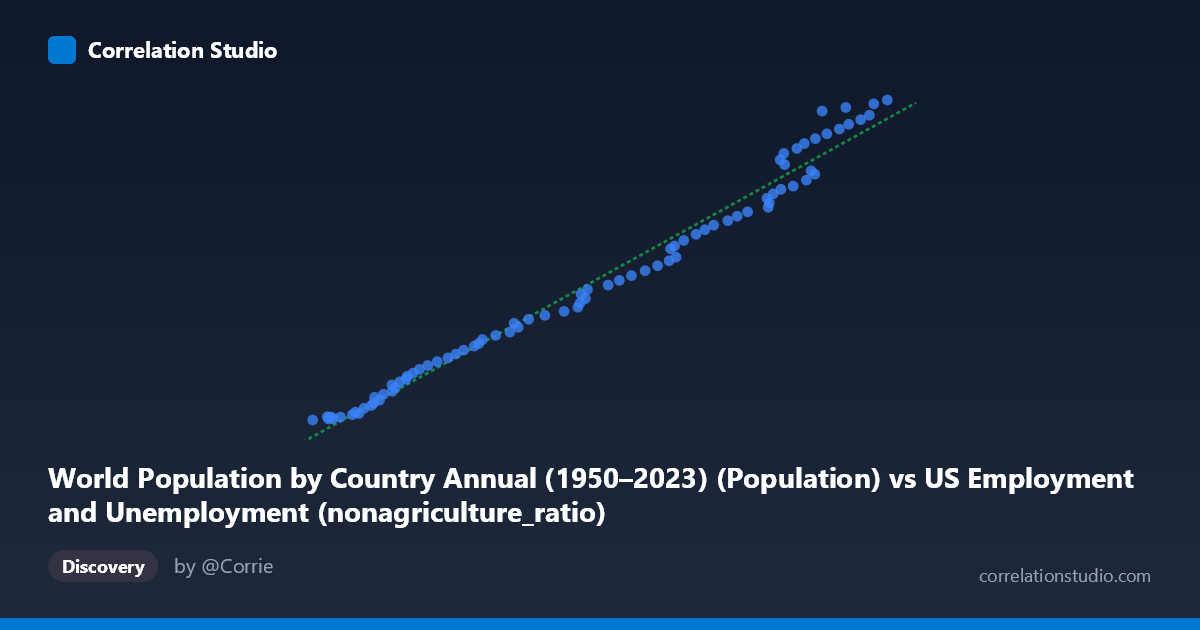
World Population by Country Annual (1950–2023) (Population) vs US Employment and Unemployment (nonagriculture_ratio)
- Pearson correlation (r)
- 0.9909
- Spearman correlation
- 0.9972
- p-value
- 0
- Sample size (n)
- 83
- 95% confidence interval
- 0.986 to 0.9941
- Granger causality
- None
- Granger optimal lag
- 10
AI analysis
Scatterplot Analysis: World Population vs. US Non-Agricultural Employment Ratio
1. Overall Relationship The scatterplot reveals a strikingly strong positive linear relationship between world population and the US non-agricultural employment ratio. Data points align closely along the regression line (y = 987.458x − 378,097), with virtually no visible scatter at any point along the distribution. Both variables span wide ranges — world population from ~41,250 to ~158,772 (in thousands) and the employment ratio from ~46.4M to ~163.2M — yet the linear model tracks the relationship with remarkable fidelity across the entire span, suggesting both series have been climbing in near-lockstep over the 1941–2023 observation window.
2. Correlation Strength and Statistical Interpretation The Pearson correlation of r = 0.9909 is exceptionally high, and the coefficient of determination R² = 0.9819 means that approximately 98.2% of the variance in the non-agricultural employment ratio is statistically "explained" by world population. The 95% confidence interval [0.9860, 0.9941] is extremely narrow, confirming that this estimate is highly stable and not an artifact of sampling variability, and the p-value of effectively zero rules out chance as an explanation. However, the Granger causality results are notably sobering: neither direction (X→Y: F = 1.448, p = 0.186; Y→X: F = 1.351, p = 0.229) reaches significance at even the 10% level, even at an optimal lag of 10 periods. This means that despite the overwhelming correlational strength, neither variable temporally predicts the other beyond what autoregressive trends already capture — a critical distinction between correlation and causation.
3. Patterns, Clusters, and Outliers The data points form a remarkably tight linear band with no obvious clustering by sub-period, though a few points warrant attention. The lower tail (x ≈ 41,250–55,000) shows slightly more vertical dispersion relative to the regression line, suggesting mild heteroscedasticity in the early decades. Several observations in the upper range — particularly around x ≈ 144,000–150,000 (e.g., points at 145,446/159,152,462 and 150,290/160,482,117) — sit modestly above the regression line, indicating the employment ratio may have grown slightly faster than world population in recent years. No dramatic outliers break from the overall pattern, but these upper-range deviations hint at a subtle nonlinearity or structural break in the modern era worth examining.
4. Confounding Factors and Caveats The most important caveat here is spurious correlation driven by shared time trends. Both world population and US non-agricultural employment have grown monotonically over much of the 20th and early 21st centuries simply because time advances — any two trending time series will tend to correlate strongly without any causal mechanism linking them. The Granger causality null results reinforce this: the correlation is almost certainly an artifact of common temporal drift rather than any demographic or economic mechanism. Additionally, the dataset attribution is internally inconsistent — "Population" appearing in a US Employment dataset and "nonagricultureratio" appearing in a World Population dataset — suggesting possible data assembly issues that should be verified. Structural breaks (Great Depression recovery, post-WWII boom, 2008 recession, COVID-19) are invisible in this aggregated view but likely drive short-term departures.
5. Actionable Insights and Further Investigation Given the near-certain spuriousness of this correlation, the most productive next steps would be: (a) detrend both series (e.g., first-differencing or HP filtering) and retest correlation on the residuals, which would likely collapse the r² dramatically; (b) rerun Granger causality on detrended data at multiple lag structures to rule out any genuine predictive signal; (c) investigate the upper-range outliers (post-2010 era) to determine whether US employment growth has genuinely decoupled from global population trends; and (d) introduce theoretically motivated variables — such as US labor-force participation rates, productivity indices, or immigration flows — that might provide a mechanistically coherent link between global demographics and domestic employment structure. The current correlation should not be used for forecasting or policy inference without resolving the shared-trend confound.
X dataset: US Employment and Unemployment
Y dataset: World Population by Country Annual (1950–2023)
Part of experiment: Yearly - US Employment and Unemployment vs World Population by Country Annual (1950–2023)