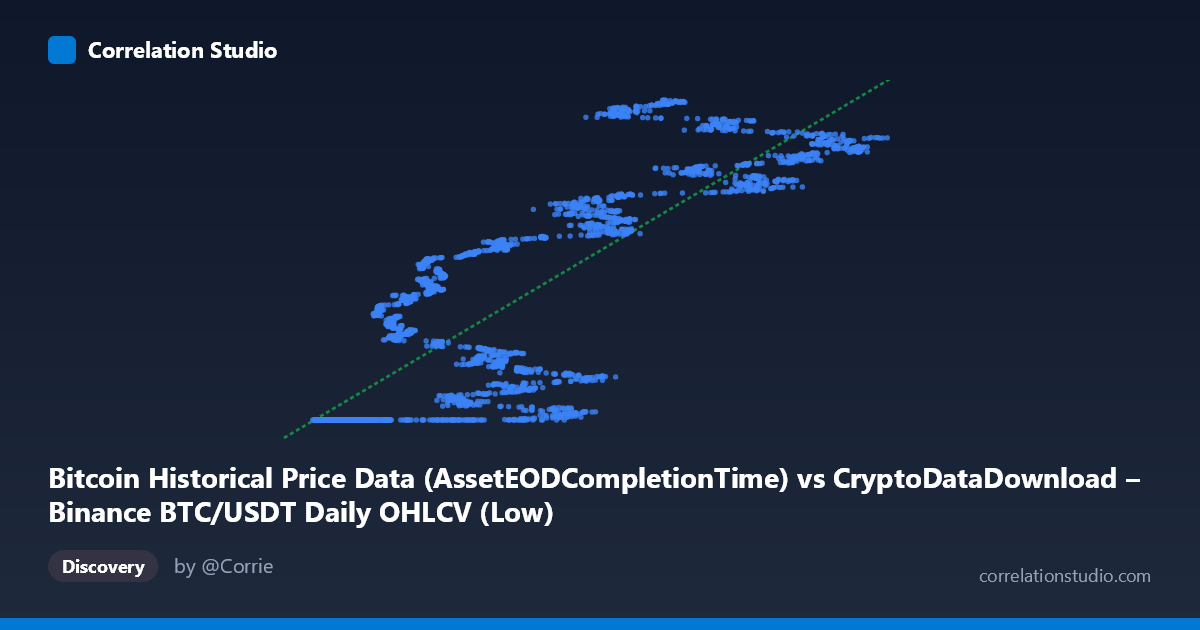
Bitcoin Historical Price Data (AssetEODCompletionTime) vs CryptoDataDownload – Binance BTC/USDT Daily OHLCV (Low)
- Pearson correlation (r)
- 0.8546
- Spearman correlation
- 0.89
- p-value
- 0
- Sample size (n)
- 3191
- 95% confidence interval
- 0.845 to 0.8637
- Granger causality
- None
- Granger optimal lag
- 10
- Time coverage
- 2017-08-17 to 2026-05-20
AI analysis
Analysis: Bitcoin Historical Price vs. Binance BTC/USDT OHLCV (Low)
1. What the Visualization Reveals
This scatterplot compares two data sources that both purport to represent Bitcoin price activity: a timestamp-based column labeled as "Historical Price Data" against the daily "Low" price from Binance BTC/USDT OHLCV data. The relationship shows a clear positive, upward-sloping trend, but with substantial dispersion around the fitted line, particularly at lower X-values where a dense cluster of points sits at a nearly flat Y-value (~1,614,337,xxx) despite X ranging from ~2,800 to ~57,000. This is unusual and suggests that the "X" variable here is not itself a price but likely a transformed or derived metric (e.g., a timestamp difference, volume-derived index, or ranking) rather than a raw price, especially given the Y-axis values are suspiciously close to Unix epoch timestamps rather than dollar prices.
2. Strength, Direction, and Statistical Confidence
The correlation coefficient (r = 0.855, r² = 0.730) indicates a moderately strong positive relationship, with about 73% of the variance in Y statistically explained by X — leaving roughly 27% unexplained by this linear model. The 95% CI [0.845, 0.864] is tight, and the p-value of ~0 confirms the correlation is highly unlikely due to random chance given the large sample (n=3,191). However, Granger causality testing shows no significant predictive direction in either direction (X→Y: p=0.35; Y→X: p=0.19) at the optimal lag of 10 periods. This is a critical caveat: despite strong contemporaneous correlation, neither series helps forecast the other over time. This pattern is classic for two variables that are both driven by a common underlying trend (e.g., overall BTC price appreciation over the 2017–2026 window) rather than one causing the other.
3. Notable Patterns and Outliers
The most striking feature is the flat cluster at low X-values (X < 60,000) where Y remains pinned near 1,614,337,000–1,614,338,000 — essentially invariant despite X varying by a factor of 20. This suggests these points may represent an early/anomalous data segment (possibly a data quality issue, placeholder values, or a different regime, such as pre-listing or a period where the Y-source hadn't yet updated). Above X ≈ 60,000, Y begins increasing more organically alongside X, following the linear trend (slope ≈ 1459) more closely. This bifurcated structure — a flat "floor" segment followed by a rising diagonal — indicates the relationship is likely non-linear or piecewise, and the global r²=0.73 may be inflated or distorted by this structural break rather than reflecting a clean linear association throughout.
4. Confounding Factors and Caveats
Several concerns warrant caution: - Units mismatch: Y-values (~1.6–1.8 billion) look like Unix timestamps, not USD prices, despite being labeled "Low" price — this suggests a possible data-join error, column mislabeling, or that Y actually encodes date/time rather than price. - Autocorrelation: Both series are time-ordered daily data over ~9 years; BTC price series are highly autocorrelated and non-stationary, which can artificially inflate r even between unrelated series (spurious correlation from shared trend/drift). - The flat cluster could reflect a merge/alignment bug (e.g., forward-filled or null-filled values during a date range) rather than genuine data. - Granger non-causality directly undercuts any narrative that one series "drives" the other — the correlation is likely coincidental/trend-driven, not mechanistic.
5. Suggested Next Steps
Before drawing conclusions, verify the actual units and definitions of both columns — the Y-axis in particular should be re-examined, as it does not resemble a price series. Investigate the flat-value cluster to determine if it reflects a legitimate market period or a data pipeline defect (check corresponding dates). Consider re-running correlation on differenced or log-returns rather than levels, which would strip out shared trend/non-stationarity and reveal whether any genuine short-term relationship exists. Finally, segment the analysis into the "flat" vs. "rising" regimes separately, since a single linear fit across both likely misrepresents the true relationship in each.
X dataset: CryptoDataDownload – Binance BTC/USDT Daily OHLCV
Y dataset: Bitcoin Historical Price Data
Part of experiment: Bitcoin - CryptoDataDownload – Binance BTC/USDT Daily OHLCV vs Bitcoin Historical Price Data