Cboe U.S. Equities Historical Market Volume Data 2021 (Tape A Shares) vs CryptoDataDownload – Binance BTC/USDT Daily OHLCV (Unix)
- Pearson correlation (r)
- -0.4457
- Spearman correlation
- -0.5068
- p-value
- 0
- Sample size (n)
- 252
- 95% confidence interval
- -0.5395 to -0.3409
- Granger causality
- None
- Granger optimal lag
- 10
AI analysis
Analysis: BTC/USDT Volume vs. Cboe U.S. Equities Market Volume (2021)
1. Relationship Overview
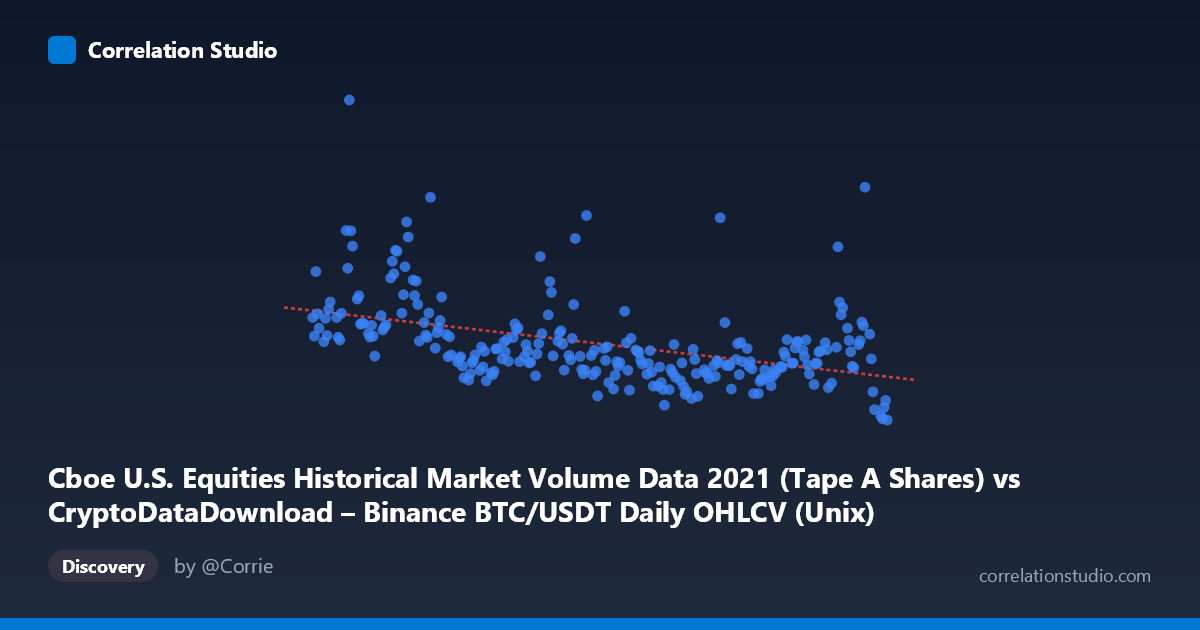
The scatterplot displays a moderate negative linear relationship between a time-based X variable (labeled as Cboe volume but numerically behaving as a timestamp axis spanning 2021) and a Y variable representing daily values in the 140M–525M range. Visually, points cluster in a downward-sloping band, with high Y-values concentrated early in the year (Q1 2021) and progressively lower values through Q4 2021, though with substantial scatter around the trend line at any given point in time.
2. Strength, Direction, and Statistical Confidence
The correlation coefficient (r = -0.4457) indicates a moderate negative association, but r² = 0.1986 reveals that only ~20% of the variance in Y is explained by X — meaning roughly 80% of Y's variability stems from other factors entirely unaccounted for in this bivariate relationship. The 95% CI [-0.5395, -0.3409] is reasonably tight and does not cross zero, and the p-value (1.06E-13) confirms this correlation is highly statistically significant — it is very unlikely to be a artifact of chance given n=252. However, statistical significance ≠ practical strength: with only 20% shared variance, X is a weak predictor of Y in isolation.
Critically, the Granger causality tests show no significant predictive direction (X→Y: p=0.781; Y→X: p=0.385). This means neither variable helps forecast future values of the other beyond what each variable's own history provides. This is an important caveat: the correlation appears to be contemporaneous/structural rather than causal or lead-lag in nature — likely both variables are declining across 2021 due to a shared external driver (time-trend), not because one influences the other dynamically.
3. Notable Patterns and Outliers
The most salient feature is a regime shift: early 2021 (Jan–Mar) shows Y-values clustering high (300M–525M), coinciding with the BTC bull run to ~$60K and elevated crypto trading volumes. From April onward, Y-values compress into a narrower, lower band (150M–260M), suggesting a structural break rather than smooth linear decay. This pattern resembles two distinct clusters/regimes more than a continuous linear relationship, which would inflate the apparent linear r while masking the true non-linear (step-like) shape. A few points (e.g., 368M in Jan, 316M in mid-Feb) stand as high-Y outliers relative to the later, tighter cluster.
4. Confounding Factors and Caveats
Since X is fundamentally a time index (Unix timestamps spanning the full year), this is less a "volume vs. volume" relationship and more a time-series trend comparison. Any two variables that both trend downward (or in opposite directions) over the same calendar year will show spurious correlation without genuine mechanistic linkage. Both crypto trading volume and equities market volume were influenced by common macro factors in 2021 (declining volatility post-Q1, reduced retail trading enthusiasm, seasonal effects), making confounding by omitted time-varying variables highly likely. The mismatched population size (N=3,212 vs. n=252 sampled) also warrants scrutiny — sampling method could introduce bias if not random.
5. Recommendations for Further Investigation
1. Detrend both series (e.g., first-differencing or removing a fitted trend) before correlating, to test whether the relationship holds beyond the shared year-long decline. 2. Segment by regime (Jan–Mar vs. Apr–Dec) and re-run correlation/regression separately to check if the pooled r is driven mainly by the Q1 cluster. 3. Identify common macro covariates (e.g., realized volatility, VIX, overall market liquidity) that might explain both series' decline simultaneously. 4. Given the null Granger result, avoid using one series to forecast the other; instead treat this as a correlational/co-movement finding only. 5. Consider non-linear or piecewise regression models given the visual suggestion of a step-change rather than pure linear decay.
X dataset: CryptoDataDownload – Binance BTC/USDT Daily OHLCV
Y dataset: Cboe U.S. Equities Historical Market Volume Data 2021
Part of experiment: Bitcoin - CryptoDataDownload – Binance BTC/USDT Daily OHLCV vs Cboe U.S. Equities Historical Market Volume Data 2021