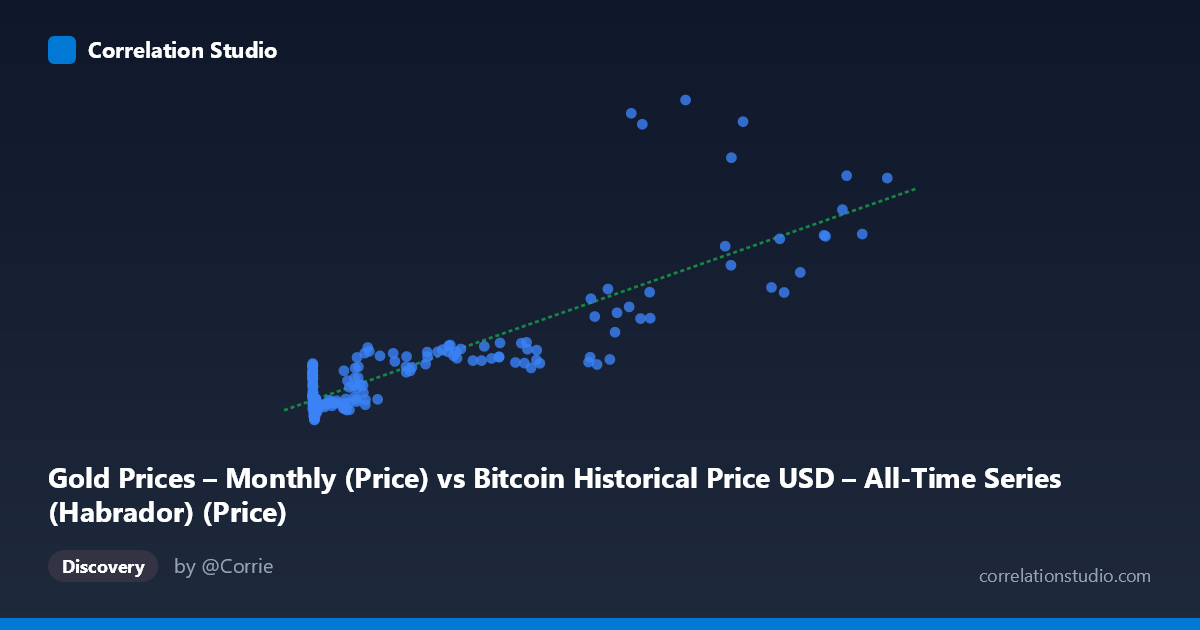
Gold Prices – Monthly (Price) vs Bitcoin Historical Price USD – All-Time Series (Habrador) (Price)
- Pearson correlation (r)
- 0.8497
- Spearman correlation
- 0.6646
- p-value
- 0
- Sample size (n)
- 189
- 95% confidence interval
- 0.8046 to 0.8851
- Granger causality
- None
- Granger optimal lag
- 10
- Time coverage
- 2010-08-01 to 2026-04-01
- Recomputed on refreshed data
- 2026-10-17 (r was 0.8498)
AI analysis
Analysis of Bitcoin Price vs. Gold Price Relationship
1. What the Visualization Reveals
The scatterplot shows a strong positive association between Bitcoin prices (X-axis) and Gold prices (Y-axis) over the 2010–2026 period. As Bitcoin's price climbs across its historical range (from fractions of a cent to over $118,000), gold prices trend upward as well (from ~$1,076 to ~$5,020). The relationship appears broadly monotonic but not strictly linear — there's a dense cluster of low-value Bitcoin points (under $1,000) where gold prices vary considerably (roughly $1,100–$1,800), while higher Bitcoin values correspond to a much narrower, more elevated band of gold prices, suggesting the relationship may be logarithmic or concave rather than purely linear.
2. Strength, Direction, and Statistical Confidence
The correlation coefficient (r = 0.85) indicates a strong positive linear relationship, with r² = 0.722 meaning about 72% of the variance in gold prices can be statistically explained by Bitcoin's price level (and vice versa, since correlation is symmetric). The 95% CI [0.805, 0.885] is tight and entirely excludes zero or weak values, and the p-value of ~0 confirms this correlation is highly unlikely to be due to chance. However, the Granger causality tests reveal no significant predictive direction in either direction (X→Y: p=0.251; Y→X: p=0.822). This is a critical distinction: strong contemporaneous correlation does not imply that movements in one asset temporally predict movements in the other. Practically, this suggests both assets may be responding to a shared external driver (e.g., macroeconomic conditions, dollar weakness, inflation expectations, risk sentiment) rather than one causing or leading the other.
3. Notable Patterns and Outliers
Several features stand out: - Early-era compression: Nearly all data points with Bitcoin prices under $1,000 (the majority of the 2010–2016 period) show gold clustered in a relatively narrow $1,100–$1,900 range, contributing little to the variance explained by the linear model. - High-value divergence: At the upper end, points like (68,074, 4,721) and (86,473, 4,309) sit noticeably above the regression line, while (94,757, 2,710) sits below it — indicating growing dispersion (heteroscedasticity) at high Bitcoin prices. This suggests gold's response to Bitcoin's price level becomes less predictable as Bitcoin matures/scales. - Non-linear curvature: The regression line (y = 0.0209x + 1319.53) likely underestimates gold prices at low X and misses curvature — a log-transform of Bitcoin price might fit better given its exponential growth scale.
4. Confounding Factors and Caveats
This correlation is almost certainly spurious or indirect rather than causal: - Time-trend confounding: Both series have grown substantially over 2010–2026. Two unrelated time series that both trend upward over a long period will often show high correlation due to shared temporal drift, not genuine economic linkage. - Non-stationarity: Neither series appears mean-reverting; both exhibit long-term secular growth, which inflates r² in ways that don't reflect a stable structural relationship. - Sample vs. population: Only 189 of 2,321 available points were sampled — every 3rd point — which may introduce aliasing if there's cyclical structure in the full series. - Macroeconomic co-movement: More plausible drivers include USD weakness, inflation, quantitative easing, and risk-on/risk-off sentiment cycles that affect both assets simultaneously as alternative stores of value.
5. Actionable Insights
- De-trend before concluding causality: Apply first-differencing or percentage-change transforms to both series and re-test correlation/Granger causality; this would isolate whether short-term moves (not shared trend) are related. - Investigate common drivers: Incorporate a third variable (e.g., DXY dollar index, real interest rates, CPI) to test whether gold and Bitcoin correlation is mediated by inflation-hedge demand. - Model non-linearity: Test a log-log regression given Bitcoin's exponential scale — this may substantially improve fit over the current linear model, especially in the low-Bitcoin-price cluster. - Treat as diversification signal, not trading signal: Given the lack of Granger causality, using Bitcoin price to predict gold price movements (or vice versa) for trading/timing purposes is not statistically supported — the relationship is contemporaneous/structural, not predictive.
X dataset: Bitcoin Historical Price USD – All-Time Series (Habrador)
Y dataset: Gold Prices – Monthly
Part of experiment: Bitcoin - Bitcoin Historical Price USD – All-Time Series (Habrador) vs Gold Prices – Monthly