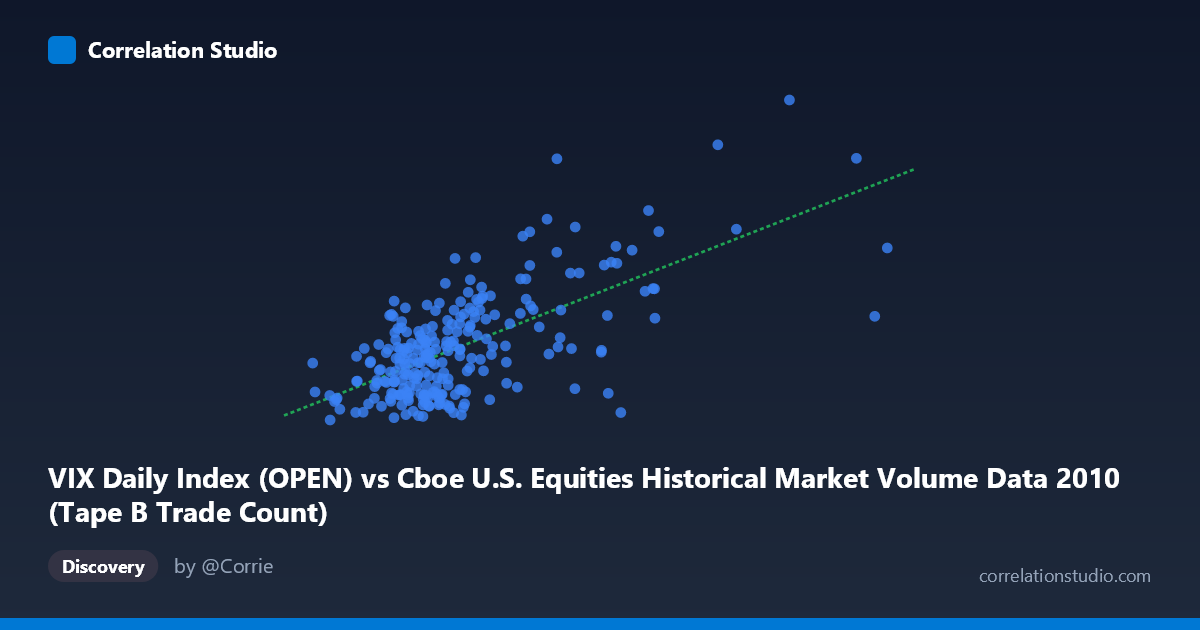
VIX Daily Index (OPEN) vs Cboe U.S. Equities Historical Market Volume Data 2010 (Tape B Trade Count)
- Pearson correlation (r)
- 0.6583
- Spearman correlation
- 0.5376
- p-value
- 0
- Sample size (n)
- 252
- 95% confidence interval
- 0.5821 to 0.7231
- Granger causality
- Y → X
- Granger optimal lag
- 1
AI analysis
Scatterplot Analysis: Market Volume vs. VIX Tape B Trade Count (2010)
Relationship Overview
The scatterplot reveals a moderately positive relationship between the Cboe U.S. Equities daily market volume (VIX Open, X-axis) and the Tape B Trade Count (Y-axis) across 252 trading days in 2010. As market volume increases, trade counts tend to rise as well — a broadly intuitive finding, since higher overall market activity would naturally be expected to generate more individual trades. The linear regression equation (y = 2.747×10⁻⁵x + 14.39) suggests that for every additional unit of market volume, the trade count increases by a small but consistent margin, with a baseline intercept near 14.4. The relationship is visible but imperfect, with considerable scatter around the regression line, indicating that volume alone does not fully determine trade counts.
Correlation Strength and Statistical Significance
The Pearson correlation of r = 0.6583 indicates a moderate-to-strong positive association. More precisely, r² = 0.4334, meaning that approximately 43.3% of the variance in Tape B Trade Count is explained by market volume — a meaningful but incomplete explanation, leaving over 56% of variance attributable to other factors. The 95% confidence interval [0.5821, 0.7231] is relatively narrow given the large sample (N = 3,302 population, n = 252 pairs), and the p-value ≈ 0 confirms the correlation is highly statistically significant, making it extremely unlikely to be a chance artifact. The Granger causality results add an important directional nuance: Y Granger-causes X (F = 4.97, p = 0.027), meaning past Tape B Trade Count values have statistically significant predictive power over future market volume, but not vice versa (X→Y: F = 1.50, p = 0.221). This unidirectional temporal relationship suggests trade count activity may be a leading indicator of broader market volume, rather than simply a derivative of it.
Notable Patterns, Clusters, and Outliers
The data display several structurally interesting features. A dense cluster exists in the lower-left region (X: ~95,000–350,000; Y: ~15–25), representing the bulk of typical trading days where both volume and trade counts remain relatively moderate. Above this core, the distribution fans outward, consistent with heteroscedasticity — the variance in trade counts grows noticeably as volume increases. Several prominent outliers stand out: the point near (778,565; 47.66) and (675,996; 43.15) represent exceptionally high-volume, high-trade-count days, likely tied to specific market events (e.g., the May 2010 Flash Crash or periods of elevated volatility). Similarly, (918,659; 32.76) is a notable anomaly — extremely high volume yet only moderate trade count — suggesting that on some days, large-block or algorithmic trades may have driven volume without proportionally increasing discrete trade counts. The lower boundary of the data also shows a few low-volume, low-count days consistent with holiday-shortened sessions.
Confounding Factors and Interpretive Caveats
Several important caveats apply. First, dataset label mismatches are worth flagging: the X-axis is labeled from "Cboe U.S. Equities Historical Market Volume" but references "VIX Daily Index (OPEN)," while the Y-axis is labeled as a "Tape B Trade Count" from a "VIX Daily Index" dataset — suggesting possible metadata mixing that warrants verification before drawing firm conclusions. Second, Tape B specifically covers NYSE American (AMEX) and regional exchange listings, so it reflects only a subset of U.S. equity activity; broader volume measures may behave differently. Third, market structure changes in 2010 — including post-Flash Crash regulatory responses — could create structural breaks in the data. Fourth, both variables are likely jointly driven by latent market conditions (volatility regimes, macroeconomic news, institutional behavior), meaning the correlation may be spurious or mediated rather than directly causal. Finally, the Granger causality finding, while statistically significant at the 1-lag level, reflects predictive association rather than true causation.
Actionable Insights and Further Investigation
Practitioners and researchers should consider several follow-up steps. The Granger causality result (Y→X) is practically actionable: Tape B Trade Count could be incorporated as a predictor variable in volume forecasting models, particularly intraday or next-day volume prediction systems. It would be worthwhile to segment the data by volatility regime (e.g., VIX above/below 25) to test whether the correlation strengthens during high-stress periods, as the outliers suggest. A non-linear or log-log regression should be tested given the apparent heteroscedasticity, potentially improving model fit beyond the current 43% explained variance. Investigating the outlier days individually — particularly the high-volume/moderate-count observation at ~918K — could reveal whether algorithmic block trading or specific event types distort the relationship. Finally, extending the analysis to multiple years would reveal whether this correlation is stable or 2010-specific, given the unusual market conditions of that year.
X dataset: Cboe U.S. Equities Historical Market Volume Data 2010
Y dataset: VIX Daily Index
Part of experiment: Daily - Cboe U.S. Equities Historical Market Volume Data 2010 vs VIX Daily Index