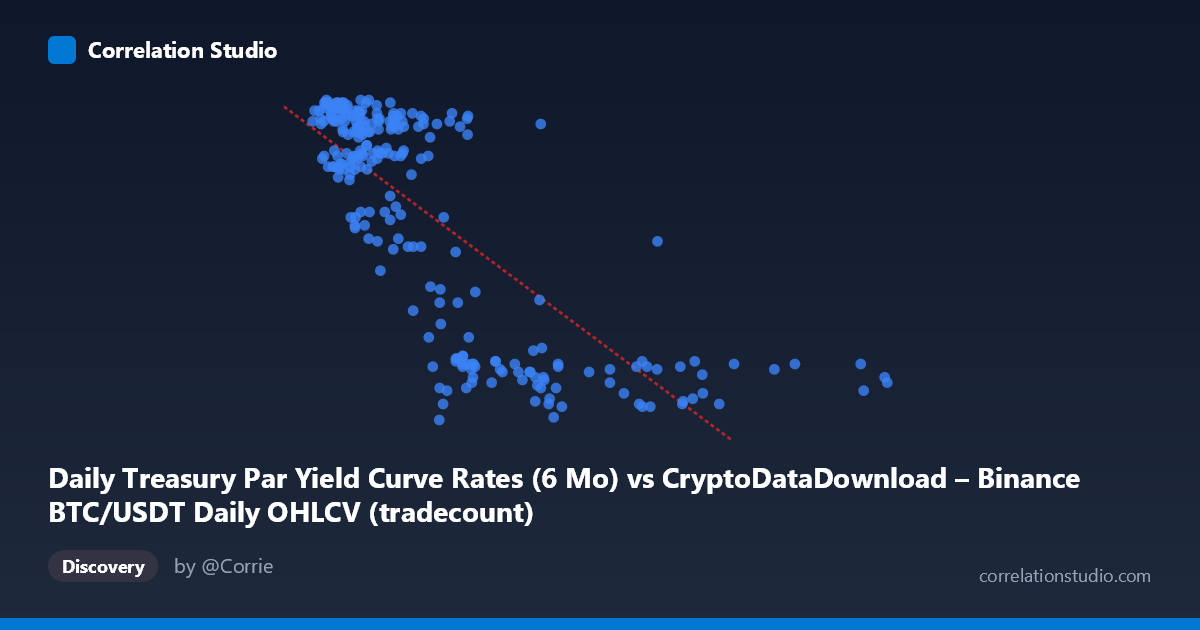
Daily Treasury Par Yield Curve Rates (6 Mo) vs CryptoDataDownload – Binance BTC/USDT Daily OHLCV (tradecount)
- Pearson correlation (r)
- -0.7714
- Spearman correlation
- -0.7399
- p-value
- 0
- Sample size (n)
- 250
- 95% confidence interval
- -0.8173 to -0.7159
- Granger causality
- None
- Granger optimal lag
- 1
AI analysis
Analysis of the Scatterplot Relationship
1. Overview of the Relationship
The scatterplot displays a clear negative, moderately-strong association between the X variable (labeled as Treasury 6-month yield, though the values ranging from ~900,000 to 12,000,000 suggest this is mislabeled and likely represents tradecount or another volume-like metric) and the Y variable (ranging 4.24–5.44, consistent with treasury yield percentages). As X increases, Y systematically decreases, with points clustering into two loose bands: a dense cluster of low-X values (under ~4,000,000) paired with high-Y values (5.0–5.4), and a sparser cluster of high-X values (8,000,000–12,000,000) paired with low-Y values (4.2–4.5).
2. Strength, Direction, and Statistical Confidence
The correlation coefficient (r = -0.7714, R² = 0.5951) indicates a strong negative linear relationship, with roughly 60% of the variance in Y statistically explained by X — a substantial but not exhaustive share, leaving 40% attributable to other factors or noise. The 95% CI [-0.8173, -0.7159] is tight and entirely negative, and the p-value of effectively 0 confirms this relationship is highly unlikely to be due to chance given n=250. However, the Granger causality tests reveal an important caveat: neither direction shows significant temporal predictive power (X→Y: p=0.112; Y→X: p=0.795). This means that despite the strong contemporaneous correlation, X does not reliably help forecast future Y values (or vice versa) — the relationship appears to be a synchronous association rather than a lead-lag causal dynamic, at least at the tested lag of 1 period.
3. Notable Patterns and Non-linearities
The data shows a distinct bimodal/clustered structure rather than a smooth continuum: a large mass of points at low X (under 4 million) with high, tightly-banded Y values (5.0–5.4), and a smaller, more diffuse group at high X (8–12 million) with low Y values (4.2–4.5). The middle range (4–8 million) is sparsely populated, suggesting either a regime shift, threshold effect, or a step-like relationship rather than pure linearity — possibly reflecting distinct market/rate regimes across the year rather than a continuous functional relationship. This clustering could inflate the apparent linear correlation.
4. Confounding Factors and Caveats
The metadata mismatch is a major concern: axis labels reference "Treasury Par Yield" for X and "tradecount" for Y, but the actual value ranges (X in millions, Y as a percentage 4-5.5) strongly suggest the labels are swapped or misassigned. This must be resolved before drawing substantive conclusions. Additionally, both series span the same calendar year (2024) and may share a common underlying driver — macroeconomic conditions, Fed policy, or overall market risk sentiment — rather than one directly causing the other. Time-series data of this nature also risks autocorrelation (trending) inflating the correlation independent of any genuine relationship between the two variables.
5. Recommended Next Steps
First, verify and correct the axis/column labeling to ensure the analysis reflects the true variables being compared. Second, given the non-significant Granger results, test additional lag structures (2, 3, 5+ days) and consider that daily crypto trading data may lead/lag treasury yields at different horizons than tested. Third, investigate the sparse middle region (4–8M) — segmenting the data by month or quarter could reveal whether this reflects a genuine regime change (e.g., a Fed rate decision date) rather than random gaps. Finally, consider a multivariate approach controlling for common macro factors (e.g., inflation prints, Fed meeting dates) to distinguish genuine bivariate dependency from shared exposure to broader market conditions.
X dataset: CryptoDataDownload – Binance BTC/USDT Daily OHLCV
Y dataset: Daily Treasury Par Yield Curve Rates
Part of experiment: Bitcoin - CryptoDataDownload – Binance BTC/USDT Daily OHLCV vs Daily Treasury Par Yield Curve Rates