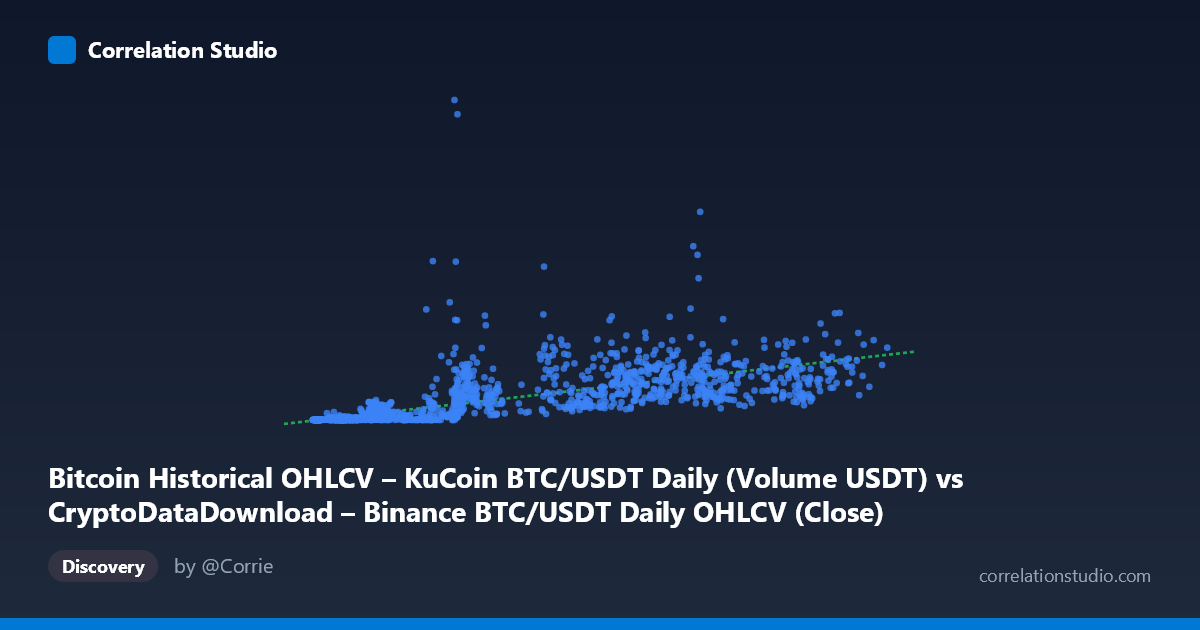
Bitcoin Historical OHLCV – KuCoin BTC/USDT Daily (Volume USDT) vs CryptoDataDownload – Binance BTC/USDT Daily OHLCV (Close)
- Pearson correlation (r)
- 0.6803
- Spearman correlation
- 0.8664
- p-value
- 0
- Sample size (n)
- 1861
- 95% confidence interval
- 0.6551 to 0.704
- Granger causality
- None
- Granger optimal lag
- 10
AI analysis
Analysis: Bitcoin Trading Volume vs. Price Relationship
1. What the Visualization Reveals
This scatterplot compares Bitcoin's daily trading volume (X-axis, in USDT) against its closing price (Y-axis, in USDT), sourced from two different exchanges (Binance and KuCoin) over a five-year span (2017–2022). At face value, this is essentially examining whether higher trading activity coincides with higher BTC prices. The data shows a positive, moderately strong relationship — as volume increases, price tends to increase as well — but the relationship is far from deterministic, with substantial scatter around the trend line.
2. Strength, Direction, and Uncertainty
The Pearson correlation (r = 0.680) indicates a moderate-to-strong positive linear relationship, but r² = 0.463 means only 46% of the variance in price is explained by volume — leaving more than half unexplained by this single variable. The 95% CI [0.655, 0.704] is tight given the large sample size (n=1,861), and the p-value of ~0 confirms this correlation is highly statistically significant and not due to chance. However, statistical significance here reflects the large sample size more than practical predictive power — r² is the more honest metric for real-world utility.
Critically, the Granger causality test shows no significant predictive direction in either direction (X→Y: p=0.575; Y→X: p=0.768). This is an important finding: despite the contemporaneous correlation, past values of volume do not help predict future prices, nor do past prices help predict future volume, at up to 10-day lags. This suggests the relationship is likely driven by a shared underlying factor (e.g., market-wide bull/bear regimes) rather than a causal lead-lag mechanism where one variable mechanically drives the other.
3. Notable Patterns and Non-Linearity
The sample points reveal a highly heteroscedastic pattern: at low volumes (X < 10,000), prices span from near-zero (~$50K–$800K in raw terms, reflecting early 2017–2018 low-liquidity periods) up to tens of millions — a huge vertical spread. At higher volumes (X 40,000), prices cluster more tightly in the hundreds of millions range, corresponding to the 2020–2021 bull run when both volume and price scaled up together. There's also a striking outlier: (29103.94, 1,237,284,954.74) — a price nearly 3–4x higher than neighboring points at similar volume levels, likely corresponding to a specific volatility spike (possibly late 2021 all-time-high territory).
The note that Spearman's ρ exceeds Pearson's r strongly suggests non-linearity — likely a logarithmic or power-law relationship, which makes intuitive sense since both price and volume in crypto markets tend to grow multiplicatively (percentage moves) rather than additively. The linear regression's negative intercept (-3.15E+07) further hints that a linear model is a poor structural fit, as it implies negative prices at low volumes, which is nonsensical.
4. Confounding Factors and Caveats
Several caveats are essential: - Trend confounding: Both variables trended strongly upward over 2017–2022 due to Bitcoin's overall market maturation and adoption growth. This shared time trend can inflate correlation without implying direct interaction — a classic spurious-correlation risk with financial time series. - Cross-exchange data: Volume is from Binance while price is from KuCoin; these exchanges may have different liquidity profiles, fee structures, and user bases, introducing measurement noise unrelated to true market dynamics. - Non-stationarity: Neither series is likely stationary (both have strong trends/volatility clustering), which can bias both correlation and Granger causality results. Standard Granger tests assume stationarity; if violated, results may be unreliable in either direction. - Scale mismatch: Y spans over 5 orders of magnitude (thousands to billions), meaning a small number of extreme high-price days may disproportionately influence both the correlation and regression fit.
5. Actionable Insights
For further investigation: 1. Log-transform both variables and re-run correlation/regression — given the Spearman/Pearson discrepancy and multiplicative nature of crypto markets, a log-log model will likely show a much better fit and more interpretable elasticity (e.g., "1% increase in volume associates with X% increase in price"). 2. Detrend or difference the series (e.g., use daily returns/percent changes instead of levels) before testing Granger causality — this addresses non-stationarity and may reveal a true lead-lag relationship masked in the raw-level analysis. 3. Segment by market regime (bull vs. bear vs. sideways periods) to check if the volume-price relationship is regime-dependent rather than constant across the full 2017–2022 window. 4. Treat this as a monitoring signal, not a trading rule — given no Granger causality, volume should not be used alone to forecast next-day price movements; consider incorporating other explanatory variables (open interest, on-chain metrics, macro indicators) for a more robust predictive model.
X dataset: CryptoDataDownload – Binance BTC/USDT Daily OHLCV
Y dataset: Bitcoin Historical OHLCV – KuCoin BTC/USDT Daily
Part of experiment: Bitcoin - CryptoDataDownload – Binance BTC/USDT Daily OHLCV vs Bitcoin Historical OHLCV – KuCoin BTC/USDT Daily