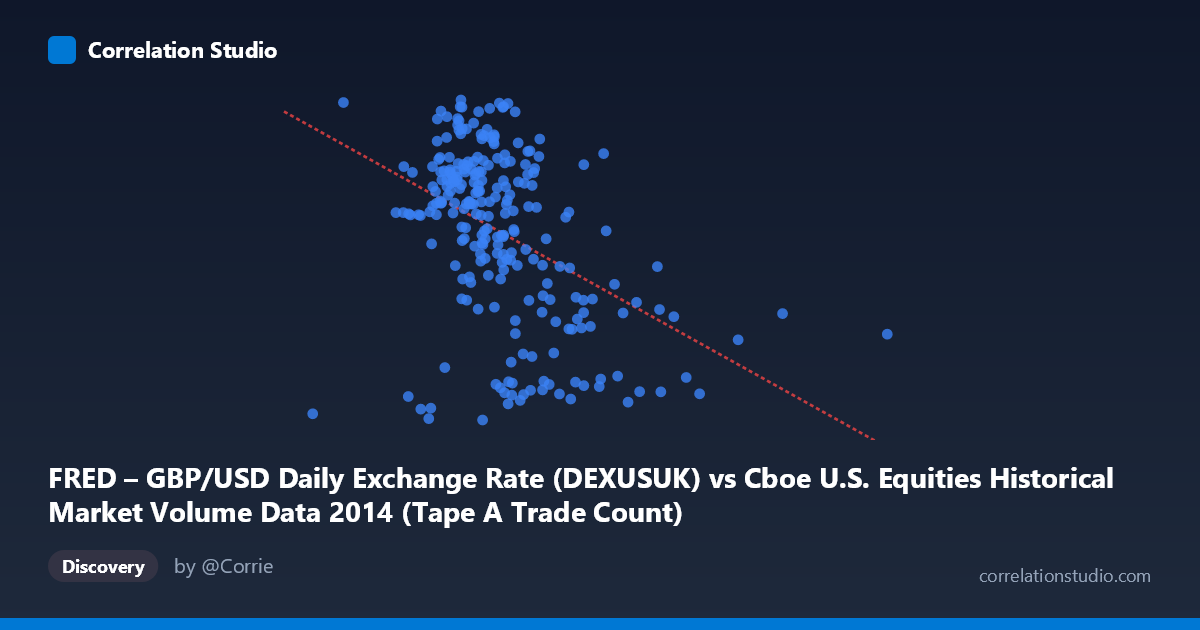
FRED – GBP/USD Daily Exchange Rate (DEXUSUK) vs Cboe U.S. Equities Historical Market Volume Data 2014 (Tape A Trade Count)
- Pearson correlation (r)
- -0.4347
- Spearman correlation
- -0.4251
- p-value
- 0
- Sample size (n)
- 249
- 95% confidence interval
- -0.5303 to -0.3281
- Granger causality
- None
- Granger optimal lag
- 1
- Time coverage
- 2014-01-02 to 2014-12-31
- Recomputed on refreshed data
- 2026-10-20 (r was -0.4347)
AI analysis
Scatterplot Analysis: GBP/USD Exchange Rate vs. Cboe Tape A Trade Count (2014)
Relationship Overview The scatterplot reveals a modest negative relationship between the GBP/USD daily exchange rate and Cboe U.S. Equities Tape A trade counts across 2014. As the exchange rate rises (stronger pound relative to the dollar), trade counts tend to decline slightly, and vice versa. The linear regression equation (y = -8.20×10⁻⁸x + 1.746) reflects an extremely shallow negative slope, suggesting that while the directional tendency is consistent, the practical magnitude of the effect per unit change in volume is quite small. The cloud of data points is visibly dispersed, with no tight clustering around the regression line, immediately signaling that the relationship — though real — is far from deterministic.
Correlation Strength and Statistical Significance The Pearson correlation of r = -0.435 indicates a moderate negative association, but the explained variance tells a more sobering story: r² = 0.189 means only 18.9% of the variance in GBP/USD is accounted for by Tape A trade volume, leaving over 81% unexplained by this relationship alone. The 95% confidence interval of [-0.530, -0.328] is entirely negative and does not cross zero, confirming directional reliability, and the p-value of 6.71×10⁻¹³ makes this correlation highly statistically significant given the sample (n = 249, N = 3,686). However, statistical significance here is partly a function of sample size — significance does not imply practical importance. Critically, Granger causality tests find no significant predictive direction in either direction (X→Y: F = 0.087, p = 0.768; Y→X: F = 0.251, p = 0.617), meaning neither variable reliably predicts the other temporally at the optimal one-period lag. This decouples statistical correlation from any actionable forecasting relationship.
Patterns, Clusters, and Outliers The data exhibits a notable horizontal spread in trade volume (roughly 527K to 2.54M), while GBP/USD values are relatively compressed between 1.55 and 1.72 — a tight ~10% band. Several high-volume outliers are visible at the far right of the x-axis (above ~1.8–2.5 million trades), and these tend to cluster at lower exchange rate values (~1.55–1.63), which visually drives much of the negative slope. The bulk of observations are concentrated between approximately 900K–1.4M in trade count and 1.60–1.70 in GBP/USD, forming a dense central mass. A handful of points with very high trade counts and low exchange rates appear to exert disproportionate leverage on the regression line, raising questions about whether a handful of high-volatility market days are distorting the overall correlation.
Confounding Factors and Caveats This correlation almost certainly reflects shared exposure to common macro drivers rather than any direct causal mechanism between U.S. equity trade volume and the GBP/USD rate. High-volume trading days in U.S. equities typically coincide with broad market uncertainty or volatility events (e.g., geopolitical shocks, Federal Reserve announcements, macroeconomic data releases), which simultaneously drive risk-off flows that can strengthen or weaken sterling. The 2014 period specifically included significant macro events — Scottish independence referendum, shifting Bank of England rate expectations, and early oil price declines — all of which could independently move both variables. Additionally, the axes appear to be swapped in labeling (the dataset descriptions indicate X is exchange rate but Y is trade count, yet the regression and correlation suggest trade count is being treated as X predictor), which warrants verification before drawing conclusions. Seasonality in equity volumes (e.g., lower summer trading) may also spuriously align with currency trends.
Actionable Insights and Further Investigation Given the lack of Granger causality and modest r², this relationship should not be used as a trading or forecasting signal in isolation. Further investigation should include: (1) introducing volatility indices (VIX) as a common-factor control to test whether the correlation disappears after accounting for market stress; (2) segmenting the data by macro event windows (e.g., FOMC dates, UK economic releases) to identify whether the correlation is episodic rather than structural; (3) testing non-linear or threshold models, as the outlier cluster at high volumes suggests a possible regime-dependent relationship; and (4) extending analysis to other tape categories (B, C) and other forex pairs (EUR/USD) to determine whether this pattern is specific to GBP or a broader equity-volume/forex phenomenon. Confirming and correcting the axis labeling should be the immediate first step.
X dataset: Cboe U.S. Equities Historical Market Volume Data 2014
Y dataset: FRED – GBP/USD Daily Exchange Rate
Part of experiment: Daily - Cboe U.S. Equities Historical Market Volume Data 2014 vs FRED – GBP/USD Daily Exchange Rate