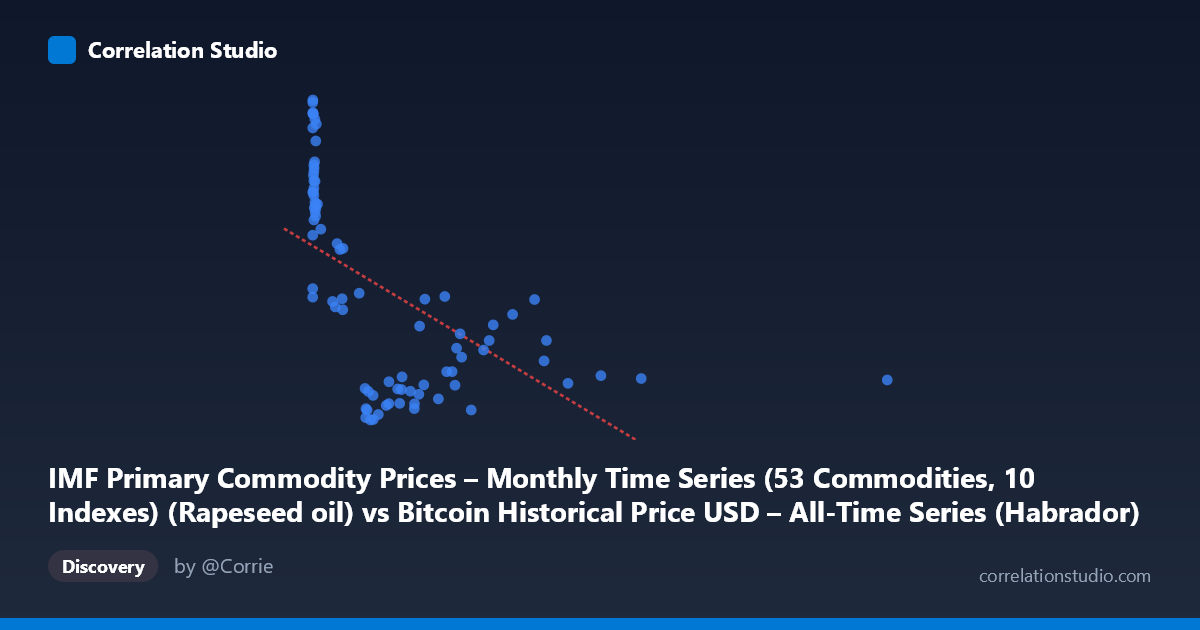
IMF Primary Commodity Prices – Monthly Time Series (53 Commodities, 10 Indexes) (Rapeseed oil) vs Bitcoin Historical Price USD – All-Time Series (Habrador) (Price)
- Pearson correlation (r)
- -0.5688
- Spearman correlation
- -0.702
- p-value
- 0
- Sample size (n)
- 83
- 95% confidence interval
- -0.6988 to -0.4025
- Granger causality
- None
- Granger optimal lag
- 10
AI analysis
Analysis: Bitcoin Price vs. Rapeseed Oil Price Index
1. What the Visualization Reveals
The scatterplot shows a moderate negative relationship between rapeseed oil prices (X) and Bitcoin's historical USD price (Y). The data forms a distinctive pattern: a dense cluster of points at low X-values (near 0–50) spanning a wide range of Y-values (roughly 950–1450), followed by a more scattered, gradually declining trend as X increases toward 2452. This shape—a wide vertical spread at low X collapsing into a narrower band at high X—suggests the relationship is not simply linear but potentially curvilinear or heteroskedastic.
2. Strength, Direction, and Statistical Confidence
The Pearson correlation of r = -0.569 indicates a moderate negative linear relationship, with r² = 0.324 meaning only about 32% of the variance in Bitcoin price is explained by rapeseed oil price movements (or vice versa)—leaving roughly 68% attributable to other factors. The 95% CI [-0.699, -0.403] is reasonably tight and entirely negative, and the p-value (2.0×10⁻⁸) is highly significant, so we can be confident a real negative association exists in this sample—but the magnitude of that association is only moderate, not strong. Critically, the Granger causality tests show no significant predictive direction either way (X→Y: p=0.838; Y→X: p=0.173), meaning neither series reliably forecasts the other over time despite the contemporaneous correlation. This is an important distinction: correlation here reflects a static/contemporaneous statistical association, not a temporal causal or leading-indicator relationship.
3. Notable Patterns and Non-linearity
The most striking feature is the cluster of ~15-20 points at very low X (X < 20) with high Y values (1150–1450)—these appear to be early Bitcoin price observations paired with near-zero rapeseed oil index readings. This cluster heavily influences the linear fit. Beyond this cluster, the remaining points show a much gentler, almost flat decline as X increases from 100 to 2452. The note that Spearman ρ exceeds Pearson r confirms suspected non-linearity—likely a steep initial drop followed by a plateau, better modeled by a logarithmic or power-law curve than a straight line. There's also a visible outlier at X=2452.18 (Y=830), far removed from the rest of the X distribution, which may exert outsized leverage on the linear regression slope.
4. Confounding Factors and Caveats
This pairing is unusual and likely spurious in a causal sense: Bitcoin price and rapeseed oil prices have no obvious economic mechanism linking them directly. The apparent correlation is almost certainly driven by a shared confound: time/trend. Bitcoin's price has grown roughly monotonically (with volatility) since 2010, while commodity indexes like rapeseed oil follow independent agricultural/energy cycles. If both series trend over the 2010–2017 window (one up, one down or non-monotonic), naive correlation will pick up spurious association without genuine dependence. Additionally, n=83 paired points drawn from a population of 449 monthly observations means significant temporal aggregation/sampling choices could affect results, and Bitcoin's early-era extreme volatility (small denominator effects, exponential growth) can distort standard Pearson calculations.
5. Actionable Insights and Further Investigation
- De-trend both series (e.g., first-differencing or percent-change) before computing correlation to check whether the relationship survives after removing shared time trends—this is essential given the Granger non-causality result. - Fit non-linear models (log-log, polynomial) given the Spearman/Pearson divergence; a log transform of Bitcoin price is standard practice given its exponential growth pattern. - Treat this as a spurious/confounded correlation unless a plausible economic mechanism (e.g., shared macro risk-off sentiment, USD strength, or inflation-hedging behavior) can be articulated and tested. - Given the lack of Granger causality, this pairing should not be used for predictive/trading purposes; instead, investigate common third factors (USD index, global risk sentiment, oil prices broadly) as mediating variables.
X dataset: Bitcoin Historical Price USD – All-Time Series (Habrador)
Y dataset: IMF Primary Commodity Prices – Monthly Time Series (53 Commodities, 10 Indexes)
Part of experiment: Bitcoin - Bitcoin Historical Price USD – All-Time Series (Habrador) vs IMF Primary Commodity Prices – Monthly Time Series (53 Commodities, 10 Indexes)