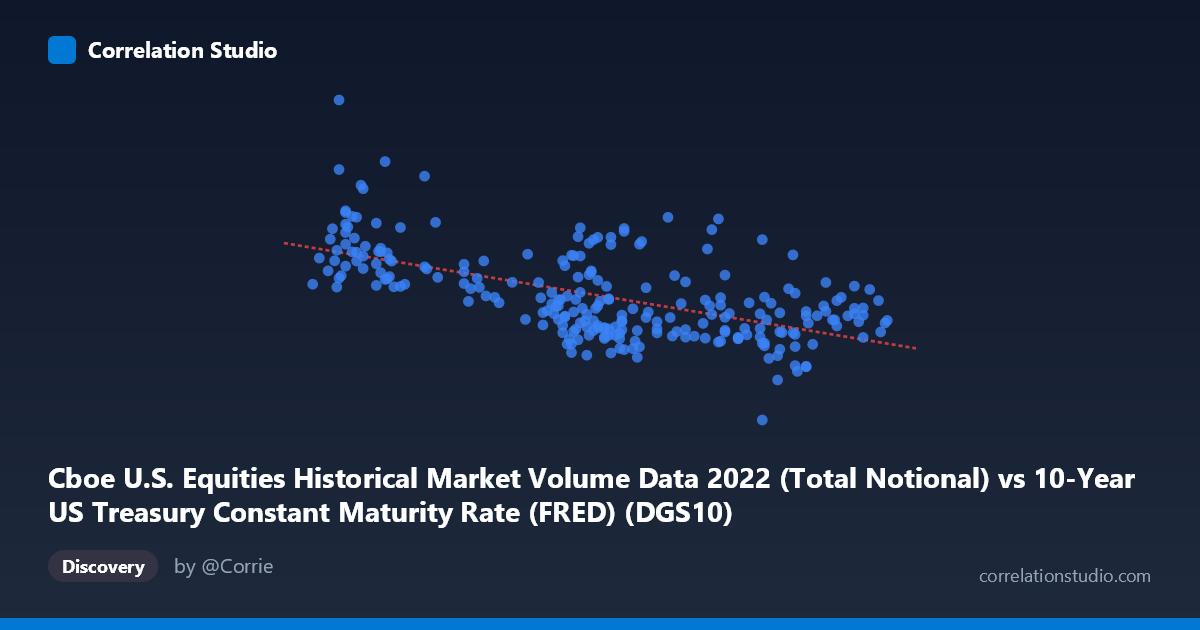
Cboe U.S. Equities Historical Market Volume Data 2022 (Total Notional) vs 10-Year US Treasury Constant Maturity Rate (FRED) (DGS10)
- Pearson correlation (r)
- -0.5955
- Spearman correlation
- -0.5663
- p-value
- 0
- Sample size (n)
- 249
- 95% confidence interval
- -0.6702 to -0.5088
- Granger causality
- None
- Granger optimal lag
- 10
AI analysis
Scatterplot Analysis: 10-Year Treasury Yield vs. Cboe Equity Market Notional Volume (2022)
Relationship Overview
The scatterplot reveals a moderate negative relationship between the 10-year US Treasury constant maturity rate (x-axis) and Cboe US equities total notional trading volume (y-axis) across 249 trading days in 2022. As Treasury yields rose — ranging from approximately 1.63% to 4.25% over the year — notional equity trading volume generally declined from peaks near $50–62 billion toward lower levels around $10–28 billion. The linear regression equation (y = −6.07×10⁹x + 4.81×10¹⁰) quantifies this inverse slope: each one-percentage-point increase in the 10-year yield is associated with roughly a $6.07 billion reduction in daily notional equity volume. This directional story is intuitive — 2022 was a year defined by aggressive Federal Reserve rate hikes, and rising yields typically coincide with equity market de-risking and reduced speculative activity.
Correlation Strength, Explained Variance, and Causality
The Pearson correlation of r = −0.5955 indicates a moderate-to-strong negative association, but the r² of 0.3546 is the more sobering statistic: Treasury yields explain only about 35.5% of the variance in notional equity volume, meaning nearly two-thirds of volume variability is driven by other factors entirely. The 95% confidence interval for r of [−0.6702, −0.5088] is reassuringly tight and does not cross zero, and the p-value of effectively 0 (against a population of N = 4,769) confirms this is not a chance finding. However, the Granger causality results are notably null — neither direction (X→Y: F = 1.45, p = 0.162; Y→X: F = 1.27, p = 0.249) achieves significance at conventional thresholds. This is a critical caveat: despite a meaningful contemporaneous correlation, yield levels do not temporally predict future volume (nor vice versa) at the optimal 10-day lag. The relationship is associative and likely co-driven by shared macro forces rather than one variable mechanistically causing the other.
Patterns, Clusters, and Outliers
Several structural features stand out in the data. There is a visible high-volume cluster at low yields (roughly x = 1.63–2.20), where notional volume spans a wide range from ~$31B to ~$51B, suggesting that low-yield environments permit but do not guarantee high volume — variance is notably large here. As yields climb above 3.0%, the distribution tightens and compresses downward, with most observations falling between $20B and $35B. A handful of outliers deserve attention: points near (1.75, $51.2B) and (1.81, $43.4B) show exceptionally high notional volume at low yields, while some mid-yield observations around x = 3.05 show surprisingly elevated volume (~$40–41B), breaking the general trend. These anomalies likely correspond to specific high-volatility event days (e.g., FOMC announcements, CPI releases) where volume spiked regardless of yield level.
Confounding Factors and Interpretive Caveats
Several confounds complicate a clean causal interpretation. First, 2022 is a highly unusual sample — it represents one of the fastest rate-hiking cycles in modern Fed history, meaning yield and volume changes were both simultaneously driven by the same macro policy shock rather than one causing the other. Second, notional volume is mechanically sensitive to equity price levels: as stock prices fell during 2022's bear market, the same number of shares traded produces lower notional value, creating a spurious component to the correlation. Third, yield itself is a continuous time-series that trended monotonically upward through most of 2022, introducing potential serial autocorrelation that inflates the apparent correlation between two time-trending variables. The null Granger result reinforces this concern — the correlation may largely reflect shared temporal trends rather than a structural economic relationship.
Actionable Insights and Further Investigation
Practitioners should avoid treating this correlation as a predictive trading signal: the Granger test clearly shows that knowing today's yield does not improve forecasts of tomorrow's volume beyond baseline. For further investigation, it would be valuable to detrend both series (e.g., use first differences or residuals from a time trend) to test whether the correlation persists after removing the shared upward drift in yields and downward drift in volume. Additionally, controlling for VIX (implied volatility) and equity index returns as covariates in a multivariate regression would likely absorb a substantial portion of the unexplained 64.5% variance and might substantially reduce the yield coefficient. Finally, repeating this analysis across multiple calendar years with varying rate regimes would test whether this relationship is structural or unique to the 2022 hiking cycle — a critical step before drawing any generalizable conclusions about yield-volume dynamics.
X dataset: 10-Year US Treasury Constant Maturity Rate (FRED)
Y dataset: Cboe U.S. Equities Historical Market Volume Data 2022
Part of experiment: Daily - 10-Year US Treasury Constant Maturity Rate (FRED) vs Cboe U.S. Equities Historical Market Volume Data 2022