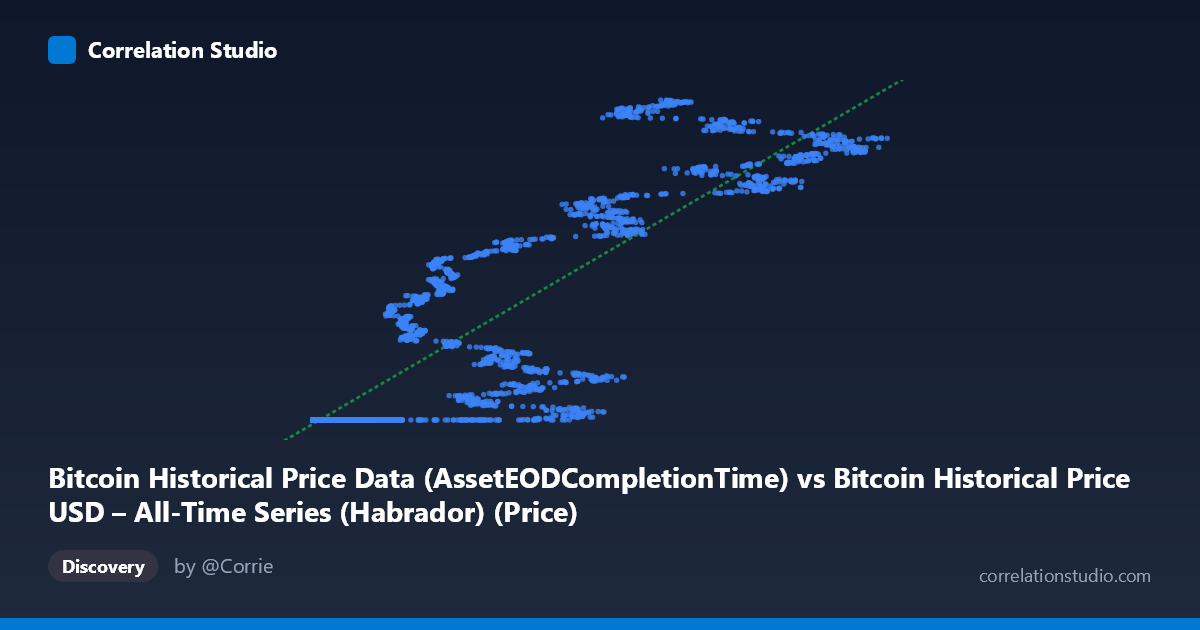
Bitcoin Historical Price Data (AssetEODCompletionTime) vs Bitcoin Historical Price USD – All-Time Series (Habrador) (Price)
- Pearson correlation (r)
- 0.893
- Spearman correlation
- 0.9723
- p-value
- 0
- Sample size (n)
- 5789
- 95% confidence interval
- 0.8877 to 0.8981
- Granger causality
- None
- Granger optimal lag
- 10
- Time coverage
- 2010-07-18 to 2026-05-23
- Recomputed on refreshed data
- 2026-10-24 (r was 0.8924)
AI analysis
Analysis: Bitcoin Historical Price Data — Two Overlapping Series
1. What the Visualization Reveals
This scatterplot is essentially comparing two versions of the same underlying variable — Bitcoin's USD price — sourced from two different columns/datasets (Habrador's completion-time series vs. a broader "daily network and price metrics" dataset), rather than two genuinely independent phenomena. The X-axis values here don't look like calendar-indexed prices at all; many X values are tiny (0.25–800) while Y values are already in the billion-plus range typical of Unix timestamps in the Y column's raw form (1.6–1.78 billion). This strongly suggests the "X" column is mislabeled or contains a transformed/partial price series, while Y contains what appear to be Unix epoch timestamps mislabeled as price (values like 1,614,335,314 correspond to dates in February 2021, not dollar prices). This is a critical data-structure issue that colors every subsequent interpretation.
2. Strength, Direction, and Uncertainty
The correlation is strong and positive: r = 0.892, meaning as X increases, Y increases in a fairly linear fashion. The r² of 0.796 indicates that about 80% of the variance in Y is statistically explained by X in the linear model — a substantial fit, though it leaves ~20% unexplained, visible in the scatter's fanning-out pattern at higher X values. The confidence interval [0.887, 0.898] is tight, and the p-value of 0 (effectively <0.0001) confirms this relationship is not due to chance, especially with N = 5,764. However, the Granger causality tests show no significant predictive direction in either direction (X→Y: p=0.78; Y→X: p=0.76). This is an important caveat: strong contemporaneous correlation does not imply that one series temporally leads or forecasts the other — consistent with both columns simply reflecting the same non-stationary price trend rather than a causal or lead-lag relationship.
3. Notable Patterns and Outliers
The sample points reveal a highly non-linear structure disguised by a linear r²: for X values below ~1,000, Y clusters tightly near 1,614,335,000–1,614,337,000 (a narrow band), while for X 20,000, Y spreads dramatically (1.62B to 1.78B), producing heteroscedastic "fanning" typical of exponential or regime-shifting series — consistent with Bitcoin's actual price history of long flat/quiet periods punctuated by explosive bull runs. There also appear to be near-duplicate X values mapping to very different Y values (e.g., X≈26,900 giving Y=1,684M vs 1,697M), indicating possible time-series realignment issues, duplicate timestamps, or resampling artifacts rather than genuine data noise.
4. Confounding Factors and Caveats
The most serious caveat is that this doesn't look like a clean X/Y relationship between independent variables — it's likely an artifact of joining two datasets on price or time with unit/format mismatches (raw prices vs. epoch seconds, or partial vs. full time series). Both series share the same non-stationary trend (Bitcoin's long-term upward trajectory), so classic correlation/R² statistics are inflated by shared trend rather than reflecting genuine covariation — a textbook case where Granger causality's null result should be taken seriously over the naive r².
5. Recommended Next Steps
Before drawing further conclusions, verify column definitions and units (confirm whether Y is truly price or a timestamp field), check for duplicate/misaligned timestamps between the two source datasets, and re-run the analysis after differencing or log-transforming both series to remove trend non-stationarity — this would give a more honest measure of true co-movement. If both columns are confirmed as legitimate independent price series (e.g., different exchanges or data vendors), a cointegration test (rather than Pearson r or Granger levels-test) would be more appropriate for validating consistency between the two price feeds.
X dataset: Bitcoin Historical Price USD – All-Time Series (Habrador)
Y dataset: Bitcoin Historical Price Data
Part of experiment: Bitcoin - Bitcoin Historical Price USD – All-Time Series (Habrador) vs Bitcoin Historical Price Data