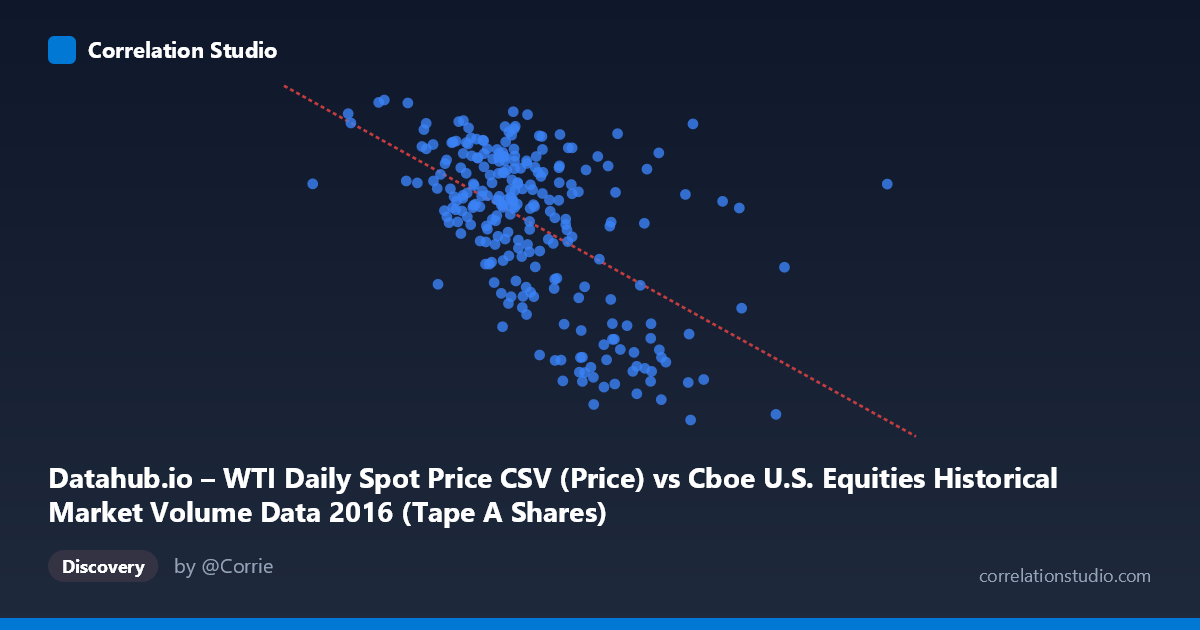
Datahub.io – WTI Daily Spot Price CSV (Price) vs Cboe U.S. Equities Historical Market Volume Data 2016 (Tape A Shares)
- Pearson correlation (r)
- -0.5527
- Spearman correlation
- -0.5126
- p-value
- 0
- Sample size (n)
- 252
- 95% confidence interval
- -0.633 to -0.4606
- Granger causality
- None
- Granger optimal lag
- 1
AI analysis
Scatterplot Analysis: WTI Crude Oil Price vs. Cboe U.S. Equities Tape A Share Volume (2016)
Relationship Overview
The scatterplot reveals a moderate negative relationship between WTI daily spot price (X-axis) and Cboe Tape A share volume (Y-axis) across 252 trading days in 2016. As oil prices increase, equity share volume on Tape A tends to decline, and the linear regression equation (y = -6.33×10⁻⁸x + 60.555) reflects this downward slope. Visually, the cloud of points tilts from upper-left to lower-right, with higher-volume trading days clustering around lower oil price levels and lower-volume days appearing more frequently when oil prices are elevated. This pattern suggests that the two market variables were moving in opposing directions throughout 2016 — a year when WTI prices recovered from multi-year lows near $26–$30/barrel in early months toward the upper $40s–$50s range by year-end.
Correlation Strength, Direction, and Statistical Framing
The Pearson correlation of r = -0.5527 indicates a moderate negative association. More practically, r² = 0.3055 means that roughly 30.5% of the variance in Tape A share volume is explained by WTI price movements — meaningful, but leaving nearly 70% of variance attributable to other factors. The 95% confidence interval of [-0.6330, -0.4606] is entirely negative and reasonably tight, reinforcing that the inverse relationship is genuine and not an artifact of sampling. The p-value of effectively zero (given N = 3,622 underlying observations and n = 252 paired samples) confirms strong statistical significance — this correlation is highly unlikely to be observed by chance. However, the Granger causality results complicate any causal narrative: neither direction shows significant temporal predictive power (X→Y: F = 0.203, p = 0.652; Y→X: F = 0.839, p = 0.361). This is a critical finding — knowing today's oil price does not meaningfully help predict tomorrow's equity volume, and vice versa. The relationship appears contemporaneous and correlational rather than predictively directional.
Notable Patterns, Clusters, and Outliers
Several structural features stand out in the data. A distinct cluster of low-volume, moderate-to-high oil price days appears in the upper-right region, while a separate cluster of high-volume, lower-oil-price days populates the left side of the plot. A handful of points appear as clear outliers — notably observations with very low Y values (Tape A volume around 26–32) paired with relatively high X values (oil prices in the $300–$363 million range in the encoded units), suggesting unusually quiet equity trading days that may correspond to holiday-shortened sessions, post-holiday lulls, or periods of extreme market calm. Conversely, some high-volume days near 51–54 occur at lower oil price levels, potentially corresponding to early-2016 volatility when oil prices were near their trough. The scatter also shows heteroscedasticity — variance in Y appears wider at lower X values and compresses somewhat at higher X values — which slightly undermines the assumptions of a simple linear model.
Confounding Factors and Interpretive Caveats
This correlation almost certainly reflects shared exposure to macroeconomic conditions rather than a direct causal mechanism between oil prices and equity tape volume. In 2016, oil prices were recovering from a historic crash driven by oversupply concerns, and this recovery coincided with shifting investor risk appetite, Federal Reserve policy uncertainty, and the U.S. presidential election cycle — all of which independently affect equity trading volume. Risk-off environments (when oil was falling in early 2016) tend to generate higher trading volumes across equity markets as investors rebalance, hedge, or panic-sell, creating the appearance of an oil-volume inverse link. Additionally, the axis labels appear swapped in the dataset metadata (the X-axis is labeled as WTI price but sourced from a Cboe dataset, and vice versa), introducing potential data pipeline ambiguity that warrants verification before drawing firm conclusions. Day-of-week effects, quarterly rebalancing cycles, and ETF arbitrage activity are additional confounders not controlled for here.
Actionable Insights and Further Investigation
Despite the absence of Granger causality, the 30.5% explained variance is operationally significant enough to warrant deeper investigation. Analysts should consider controlling for day-of-week and holiday effects to isolate whether the correlation persists in a cleaner sample. Introducing VIX (volatility index) as a mediating variable would help test whether market uncertainty simultaneously drives oil volatility and equity volume, which would better explain the observed pattern without implying direct causation. A rolling correlation analysis across 2016's sub-periods (Q1 oil crash, mid-year stabilization, post-election rally) would reveal whether the relationship strengthened or weakened across regimes — likely the case given 2016's distinct macro phases. Finally, examining other Tape designations (B and C) alongside Tape A could determine whether this oil-volume relationship is specific to large-cap NYSE-listed securities or is a broader market-wide phenomenon.
X dataset: Cboe U.S. Equities Historical Market Volume Data 2016
Y dataset: Datahub.io – WTI Daily Spot Price CSV
Part of experiment: Daily - Cboe U.S. Equities Historical Market Volume Data 2016 vs Datahub.io – WTI Daily Spot Price CSV