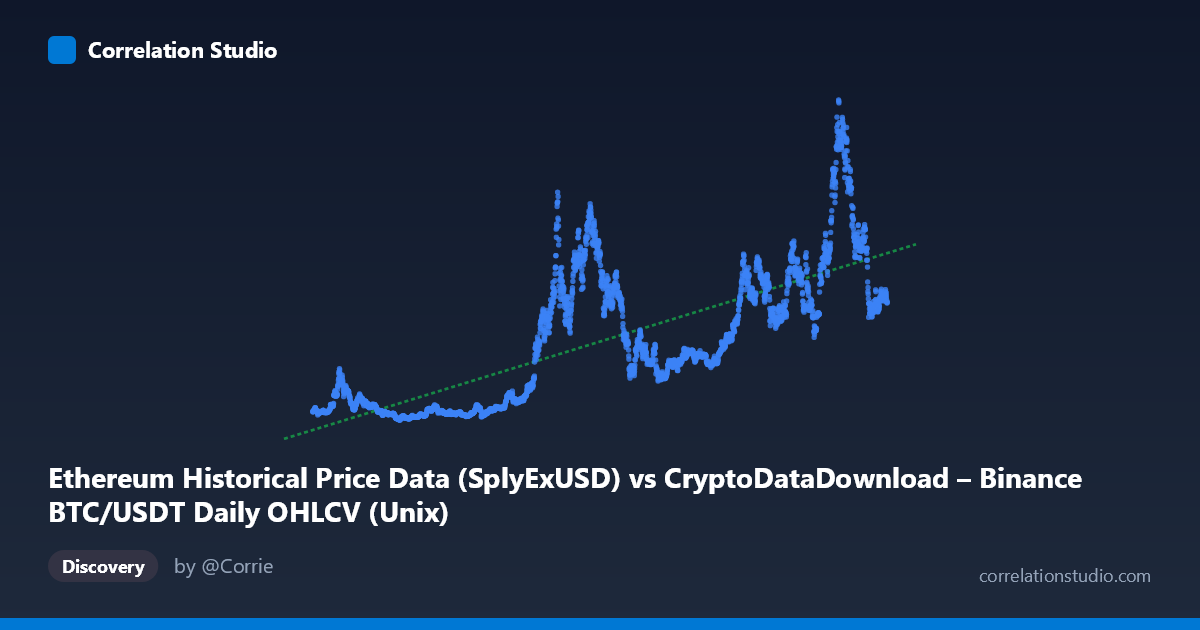
Ethereum Historical Price Data (SplyExUSD) vs CryptoDataDownload – Binance BTC/USDT Daily OHLCV (Unix)
- Pearson correlation (r)
- 0.7519
- Spearman correlation
- 0.7824
- p-value
- 0
- Sample size (n)
- 3191
- 95% confidence interval
- 0.7364 to 0.7666
- Granger causality
- None
- Granger optimal lag
- 10
AI analysis
Analysis: Ethereum Supply/Price Metric vs. BTC/USDT Time-Series Data
1. Relationship Overview
The scatterplot shows a moderately strong positive association between the X variable (labeled as Ethereum SplyExUSD, though the numeric range strongly suggests this is actually a Unix timestamp field spanning 2017–2026) and the Y variable (labeled as a Bitcoin OHLCV Unix column, but whose value range of ~$1.4B to ~$95.6B is far more consistent with a market capitalization or volume-derived series). Given the axis labels appear mismatched with the underlying data, the practical interpretation here is a time-vs-value relationship: as X increases (later dates), Y trends upward, consistent with a long-term growth pattern in crypto market metrics from 2017 through 2026.
2. Strength, Direction, and Statistical Confidence
The correlation coefficient (r = 0.752) indicates a strong positive linear relationship, with r² = 0.565 meaning roughly 56.5% of the variance in Y is explained by X (or time) — a substantial but incomplete share, leaving ~44% driven by other factors (volatility cycles, halving events, macro conditions, etc.). The 95% CI [0.736, 0.767] is tight, and p ≈ 0 confirms this correlation is highly statistically reliable given the large sample (n = 3,191), not a chance artifact. However, the Granger causality tests show no significant predictive direction in either direction (X→Y: p = 0.118; Y→X: p = 0.337) at the tested lag of 10 periods. This is a critical caveat: despite the strong contemporaneous correlation, neither series helps forecast the other's future values — the relationship is likely driven by a shared underlying trend (e.g., both being functions of calendar time or a common market cycle) rather than one causing changes in the other.
3. Notable Patterns and Non-Linearities
The linear fit (y = 0.1885x − 2.849e11) captures the general upward trend, but the data likely exhibits cyclical clustering typical of crypto markets: multiples of sample points show Y values in the $3–6B range during 2017–2020 (bear/accumulation periods), followed by dramatic increases to $30–95B during 2021, 2024–2025 bull runs. This suggests the relationship is not purely linear but stepped/regime-based, reflecting BTC's known boom-bust cycles (2018 crash, 2021 peak, 2022 crash, 2024–25 rally). Outliers such as the $95.6B maximum against relatively modest X range increments hint at parabolic price action during bull market blow-off phases, which a simple linear model will systematically underfit at the tails.
4. Confounding Factors and Caveats
Several concerns limit causal interpretation: - Metadata mismatch: The column labels reference mismatched datasets (Ethereum supply metric on X-axis vs. Bitcoin OHLCV Unix timestamp on Y-axis), suggesting a data-pipeline labeling error. The actual measured relationship may simply be "date" vs. "USD-denominated market metric," which is trivially correlated due to overall market growth over time — not a meaningful economic relationship between ETH and BTC metrics. - Non-stationarity: Both crypto prices and time-indexed metrics exhibit strong trends and autocorrelation, inflating r without indicating a genuine structural relationship (classic spurious regression risk). - Shared macro drivers: Both BTC and ETH prices are driven by common factors (liquidity cycles, regulatory news, institutional adoption), which would produce correlation without direct causality between the two specific columns as labeled.
5. Recommended Next Steps
1. Verify data pipeline/labeling — confirm whether X truly represents an Ethereum supply metric or a timestamp; correct any column mapping errors before further modeling. 2. De-trend or difference the series (e.g., use returns/log-changes instead of levels) and re-run correlation and Granger tests to check if the relationship holds after removing shared time-trend effects — this is essential given the Granger test already suggests no lead-lag structure. 3. Segment by market regime (bull/bear cycles) to test whether the linear relationship holds uniformly or is driven by specific periods (e.g., 2021 and 2024–25 rallies). 4. Test non-linear models (e.g., log-log or polynomial regression) given the apparent exponential/cyclical growth pattern in Y. 5. Cross-check with actual ETH/BTC price correlation using correctly labeled columns, since the current mismatch limits confidence in any BTC-ETH relationship conclusions drawn from this specific chart.
X dataset: CryptoDataDownload – Binance BTC/USDT Daily OHLCV
Y dataset: Ethereum Historical Price Data
Part of experiment: Bitcoin - CryptoDataDownload – Binance BTC/USDT Daily OHLCV vs Ethereum Historical Price Data