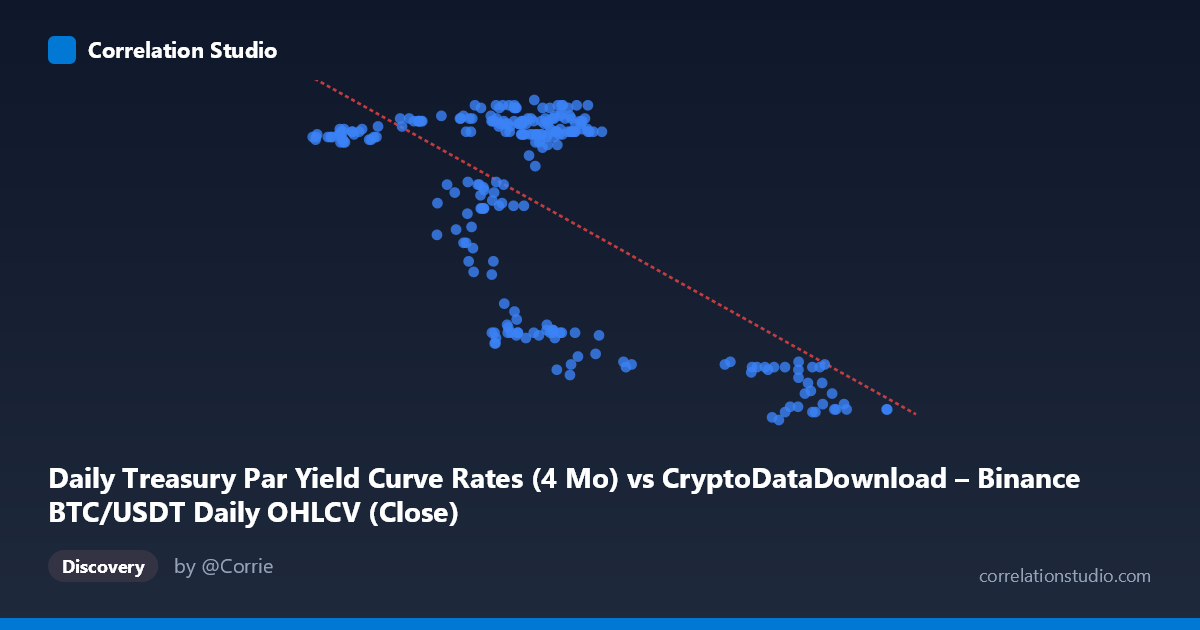
Daily Treasury Par Yield Curve Rates (4 Mo) vs CryptoDataDownload – Binance BTC/USDT Daily OHLCV (Close)
- Pearson correlation (r)
- -0.6612
- Spearman correlation
- -0.3348
- p-value
- 0
- Sample size (n)
- 250
- 95% confidence interval
- -0.7257 to -0.5851
- Granger causality
- None
- Granger optimal lag
- 1
AI analysis
Analysis of Treasury Yield vs. BTC/USDT Relationship
1. Overview of the Relationship
The scatterplot depicts an inverse relationship between the 4-month Treasury par yield and BTC/USDT closing prices across 250 daily observations in 2024. As the Treasury yield variable (X) increases, the paired value (Y) tends to decrease, though the pattern is not a tight linear band—there's considerable vertical dispersion at most X values, particularly in the 55,000–70,000 range where Y values swing from roughly 4.5 to 5.5.
2. Strength, Direction, and Statistical Confidence
The correlation coefficient of r = -0.66 indicates a moderate-to-strong negative linear relationship. The R² = 0.437 tells us that only about 44% of the variance in Y is explained by X in a linear framework—meaning more than half the variability remains unexplained, likely driven by other factors or nonlinear dynamics. The 95% confidence interval [-0.726, -0.585] is fairly narrow and entirely negative, and combined with a p-value effectively at 0, this rules out the possibility that the negative relationship is due to chance—it's a statistically robust pattern in this sample.
However, the Granger causality tests are critical for interpretation: neither direction shows significant predictive causality (X→Y: p=0.38; Y→X: p=0.34). This means that despite the strong contemporaneous correlation, past values of one series do not help forecast future values of the other at a 1-day lag. This is an important distinction—the relationship appears to be a co-movement or shared-driver phenomenon rather than one variable temporally leading the other.
3. Notable Patterns and Clusters
The data appears to separate into at least two visual regimes: - A "high-Y" cluster (Y ≈ 5.1–5.5) concentrated in the X range of ~55,000–70,000, showing relatively tight, elevated values. - A "low-Y" cluster (Y ≈ 4.3–4.7) associated with higher X values (~85,000–101,000) and also scattered within the same 55,000–70,000 X range.
This bimodal split suggests the relationship may not be purely linear but could reflect distinct market regimes or time periods (e.g., early vs. late 2024) rather than a smooth continuous decline. The mixing of high and low Y values at similar X levels (particularly 60,000–70,000) suggests a third factor or time-based structural break is influencing Y independently of X.
4. Confounding Factors and Caveats
Since both series are daily time series from 2024, they are both subject to macroeconomic trends, monetary policy shifts, and market sentiment that evolve over the year—classic conditions for spurious correlation via a shared time trend rather than direct causation. The Granger non-causality result reinforces this concern: the correlation may reflect two variables independently trending across 2024 (e.g., Treasury yields responding to Fed policy while BTC responds to crypto-specific catalysts) rather than a genuine economic linkage. Additionally, treasury yields are not typically driven by BTC/USDT prices in any direct economic mechanism, so causal interpretation should be treated cautiously—this is likely an artifact of overlapping time trends, not a fundamental market relationship.
5. Suggested Further Investigation
- Decompose by time period: Segment the data by month/quarter to check if the relationship is driven by a specific structural break (e.g., a Fed rate-cut cycle) rather than being stable throughout the year. - Detrend both series (or use returns/differences instead of levels) before correlating, to control for the shared time trend and isolate genuine co-movement. - Test longer Granger lags (e.g., 5, 10, 20 days) since 1-day lag may be too short to capture macro-driven adjustment lags between rates and crypto markets. - Incorporate a third variable (e.g., DXY, Fed funds rate expectations, or equity market indices) to check if both series are being driven by a common macro factor, which would explain the correlation without implying direct causation.
X dataset: CryptoDataDownload – Binance BTC/USDT Daily OHLCV
Y dataset: Daily Treasury Par Yield Curve Rates
Part of experiment: Bitcoin - CryptoDataDownload – Binance BTC/USDT Daily OHLCV vs Daily Treasury Par Yield Curve Rates