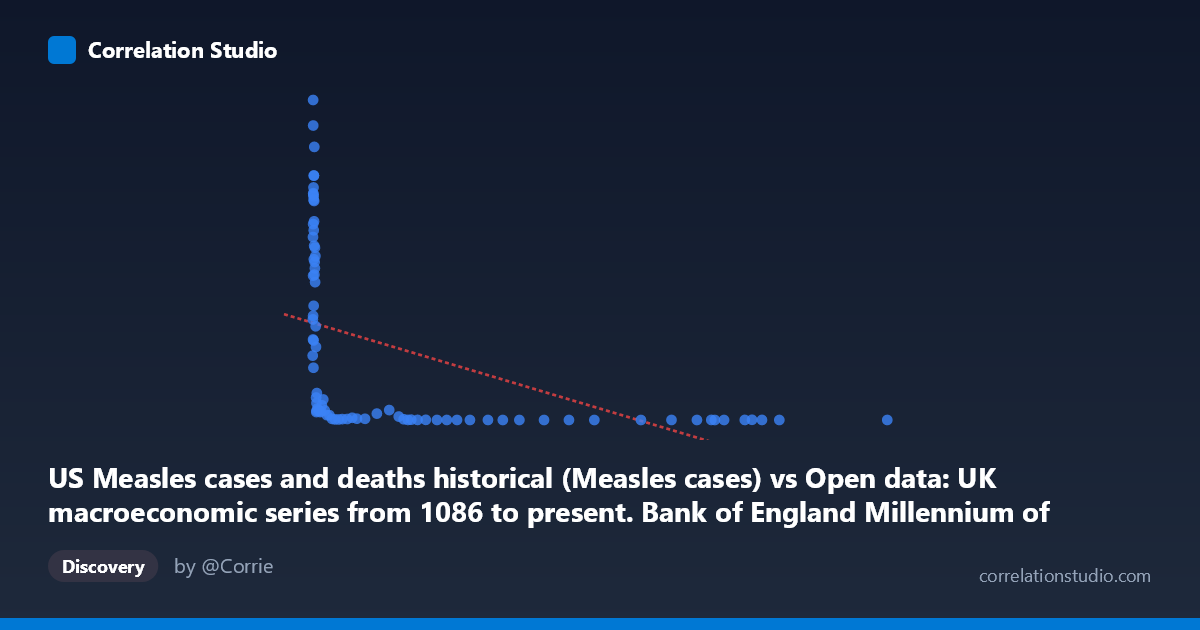
US Measles cases and deaths historical (Measles cases) vs Open data: UK macroeconomic series from 1086 to present. Bank of England Millennium of Macroeconomic Data. (Month) (value)
- Pearson correlation (r)
- -0.4693
- Spearman correlation
- -0.9101
- p-value
- 0.000007
- Sample size (n)
- 84
- 95% confidence interval
- -0.6212 to -0.2834
- Granger causality
- None
- Granger optimal lag
- 10
- Time coverage
- 1919-01-01 to 2017-01-01
- Recomputed on refreshed data
- 2026-10-17 (r was -0.4693)
AI analysis
Scatterplot Analysis: US Measles Cases vs. UK Macroeconomic Data
1. Overall Relationship Revealed
The scatterplot reveals a negative relationship between US Measles cases (X-axis) and a UK macroeconomic variable (Y-axis) spanning 1919–2017. The most visually striking feature is a pronounced hyperbolic or power-law curve rather than a linear trend: when measles cases are low (roughly below 2,000), the UK macroeconomic values are extremely high and highly variable (ranging from ~85,000 to nearly 895,000). As measles cases increase into the tens of thousands, the macroeconomic values collapse sharply toward near-zero, clustering tightly along the bottom axis. This shape is the hallmark of an inverse relationship with strong non-linearity, not a simple linear association.
2. Correlation Strength, Direction, and Causality
The Pearson correlation of r = −0.4693 indicates a moderate negative association, but this number substantially understates the true strength of the relationship because it assumes linearity. The R² of 0.2202 means only ~22% of the variance in Y is explained by X under a linear model — leaving 78% unexplained, which is largely an artifact of forcing a linear fit onto what is clearly a curved relationship. The 95% confidence interval of [−0.6212, −0.2834] confirms the negative direction is statistically robust, and the p-value of 6.7 × 10⁻⁶ places this well beyond conventional significance thresholds, making it very unlikely to be a chance finding. Critically, however, the Granger causality tests fail in both directions (X→Y: F = 0.875, p = 0.561; Y→X: F = 1.102, p = 0.378), meaning neither variable temporally predicts the other even at the optimal 10-period lag. There is no evidence of a predictive temporal mechanism in either direction. The note that Spearman ρ exceeds Pearson r further confirms the relationship is better described by a monotonic non-linear function — a logarithmic or power-law regression would likely capture substantially more variance than the reported 22%.
3. Notable Patterns, Clusters, and Outliers
Several distinct structural features emerge: - High-Y cluster (bottom-left): A dense cluster of points with X < 1,000 and Y ranging from ~85,000 to ~895,000 shows enormous vertical spread, suggesting the macroeconomic variable was highly variable during periods of low measles incidence (likely post-vaccination era years). - Extreme outliers: The point (164.44, 894,134) sits far above the cluster and likely represents a notable year in both datasets simultaneously. Similarly, (312.01, 449,146) and (290.12, 530,118) are prominent. - High-X, near-zero-Y cluster: Points like (116,836; 120), (94,899; 86), and (91,373; 191) represent years of very high measles burden with negligible macroeconomic values — these anchor the left side of the inverse curve. - Middle-range transition zone (X: 1,000–20,000): Values like (13,119; 17,914) and (15,630; 27,808) occupy a transitional zone where both variables are moderate, consistent with a smooth decay function rather than a step change.
4. Confounding Factors and Interpretive Caveats
This correlation almost certainly reflects shared temporal trends rather than any causal mechanism between US disease burden and UK macroeconomic conditions. Both variables are time-indexed from 1919–2017, and the dominant driver of both is almost certainly historical time itself: measles cases in the US declined dramatically after the 1963 vaccine introduction, while UK macroeconomic indicators (likely a nominal series such as GDP, money supply, or price level) grew substantially across the 20th century. This makes both series non-stationary, and their correlation is a textbook example of spurious correlation driven by confounded secular trends. The cross-national pairing (US health data vs. UK economic data) makes any direct causal mechanism biologically and economically implausible. Furthermore, the mismatch in dataset descriptions (the axis labels appear swapped in the metadata) suggests a possible data alignment or labeling error that warrants verification before any further interpretation.
5. Actionable Insights and Further Investigation
- Apply a log transformation to X (measles cases) immediately — a log-linear or power-law model will almost certainly produce R² well above 0.22 and yield a much better-fitting regression line consistent with the visual curve. - Detrend both series (e.g., via first-differencing or HP filter) before computing correlation, to test whether any relationship persists after removing shared secular time trends. The current correlation likely vanishes or weakens substantially after detrending. - Verify axis label alignment — the dataset descriptions appear to be swapped between X and Y axes, and confirming the correct pairing is essential before drawing any conclusions. - Re-run Granger causality on log-transformed or detrended data, as the current non-stationarity may be masking or distorting the temporal structure. - Treat this as a cautionary example of spurious correlation: the relationship likely reflects nothing more than the simultaneous passage of time — measles declining due to vaccination while UK macroeconomic nominal values grew — and should not be used to infer any health-economic linkage between the two countries.
X dataset: Open data: UK macroeconomic series from 1086 to present. Bank of England Millennium of Macroeconomic Data. (Month)
Y dataset: US Measles cases and deaths historical
Part of experiment: Yearly - Open data: UK macroeconomic series from 1086 to present. Bank of England Millennium of Macroeconomic Data. (Month) vs US Measles cases and deaths historical