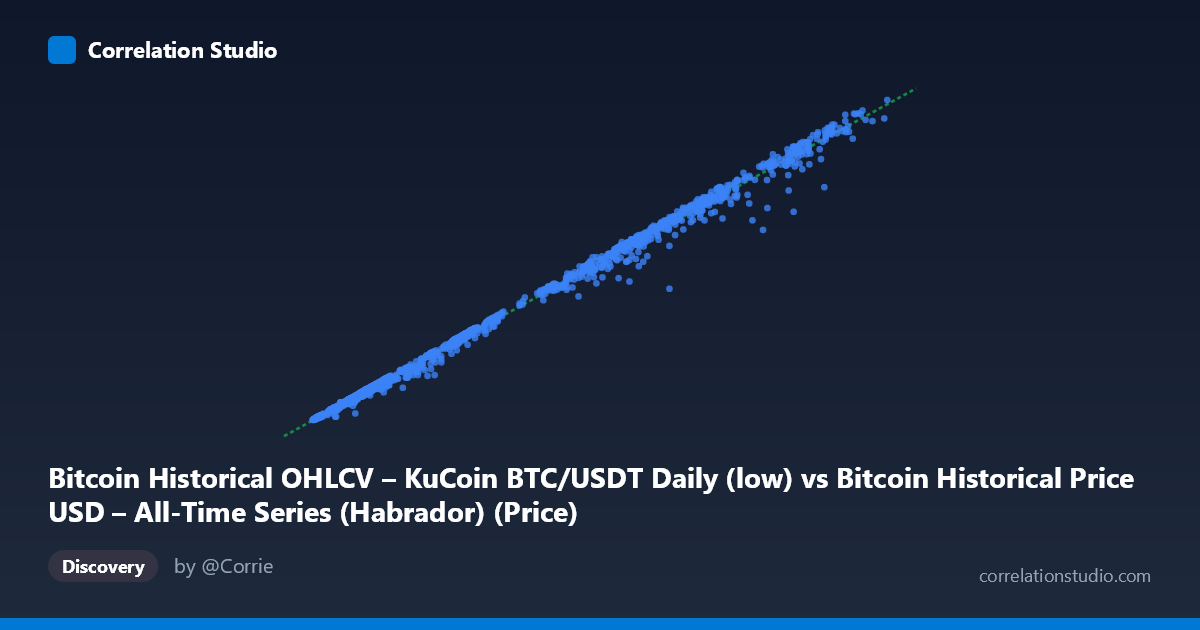
Bitcoin Historical OHLCV – KuCoin BTC/USDT Daily (low) vs Bitcoin Historical Price USD – All-Time Series (Habrador) (Price)
- Pearson correlation (r)
- 0.9982
- Spearman correlation
- 0.998
- p-value
- 0
- Sample size (n)
- 1861
- 95% confidence interval
- 0.998 to 0.9984
- Granger causality
- None
- Granger optimal lag
- 10
- Time coverage
- 2017-10-19 to 2022-11-29
- Recomputed on refreshed data
- 2026-10-24 (r was 0.9982)
AI analysis
Analysis: Bitcoin Price Cross-Source Comparison
1. What the Visualization Reveals
This scatterplot compares Bitcoin's daily low price from one historical dataset (Habrador) against the closing price from a separate exchange-specific feed (KuCoin BTC/USDT). The plot shows an almost perfectly linear relationship, with points tightly hugging the regression line y = 0.9658x + 17.13 across the entire price range—from ~$3,200 to ~$67,600. This is expected: both series are measuring the same underlying asset (Bitcoin) over the same time period, just sourced from different data providers and potentially different price fields (low vs. close/price).
2. Strength, Direction, and Uncertainty
The correlation is essentially as strong as it gets in real-world data: r = 0.9982, r² = 0.9964, meaning 99.64% of the variance in Y is explained by X — leaving less than 0.4% unexplained, likely attributable to source discrepancies, timing differences, or field definitions (low vs. price). The 95% CI [0.9980, 0.9984] is extremely narrow given the large sample (n=1,861), and the p-value of ~0 confirms this relationship is not due to chance. However, the Granger causality tests show no significant predictive direction in either direction (X→Y: p=0.122; Y→X: p=0.096). This is important: it tells us that despite the near-perfect contemporaneous correlation, neither series leads the other in a temporal forecasting sense — they move together because they represent the same event (Bitcoin's market price) recorded simultaneously, not because one drives the other.
3. Notable Patterns and Features
The relationship is remarkably linear across nearly two orders of magnitude in price (from ~$3,000 to ~$67,000), with no visible curvature, heteroscedasticity, or regime breaks in the sampled points. The slope of 0.966 (slightly below 1) suggests the Y-series (KuCoin price/close) tends to run marginally lower than the X-series (Habrador low) at higher price levels, which makes sense if X specifically captures the daily low — Y being a close or composite price would typically sit above the low, but the sub-1 slope combined with a small positive intercept suggests only minor systematic divergence, likely within normal intraday volatility. No clear outlier clusters or discontinuities are apparent in the sample, though isolated points (e.g., 44755.57 vs 40683.00, or 43136.58 vs 40875.00) show larger absolute gaps at high price levels — consistent with proportionally larger absolute spreads during high-volatility periods (bull market tops).
4. Confounding Factors and Caveats
The near-perfect correlation is somewhat a statistical artifact of comparing two measurements of the same phenomenon rather than two independent variables — this is not evidence of a causal or economically meaningful relationship, but rather a data-consistency check. Key caveats: (a) the X series is a "low" price while Y is described as "Price" (likely close), so residual variance partly reflects intraday range rather than measurement error; (b) different data sources may have timezone alignment issues, missing days, or interpolation differences that could inflate or deflate specific residuals; (c) the Granger non-significance may partly reflect the daily granularity being too coarse relative to the 10-lag window, or the fact that both series are non-stationary price levels (should ideally be tested on returns, not raw price).
5. Actionable Insights
Given the r² of 0.996, this comparison is best used as a data quality/reconciliation check between two Bitcoin price feeds rather than a genuine correlation study. Recommended next steps: (1) re-run the analysis on log-returns rather than raw price levels to properly test lead-lag dynamics and avoid spurious correlation from shared trends; (2) investigate the specific residuals (Y − X̂) to flag data points where the two sources diverge meaningfully — these could indicate exchange-specific volatility, outages, or data errors; (3) if the goal is arbitrage or cross-exchange analysis, focus on the small residual variance rather than the dominant linear trend, since that's where actionable signal (e.g., KuCoin-specific premium/discount) would live.
X dataset: Bitcoin Historical Price USD – All-Time Series (Habrador)
Y dataset: Bitcoin Historical OHLCV – KuCoin BTC/USDT Daily
Part of experiment: Bitcoin - Bitcoin Historical Price USD – All-Time Series (Habrador) vs Bitcoin Historical OHLCV – KuCoin BTC/USDT Daily