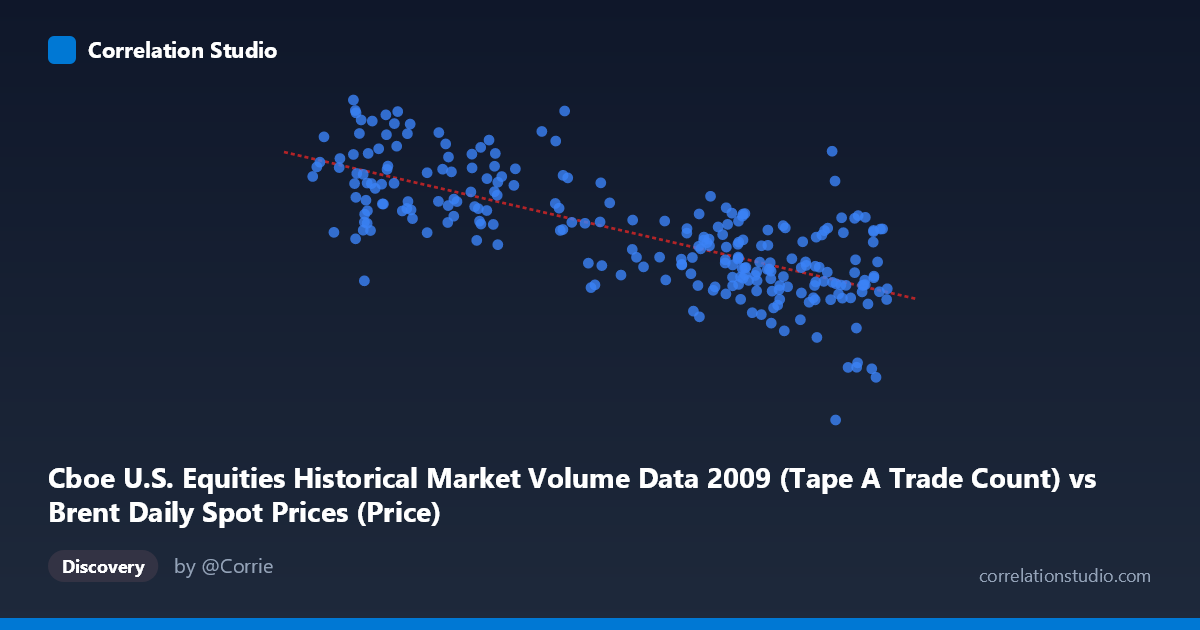
Cboe U.S. Equities Historical Market Volume Data 2009 (Tape A Trade Count) vs Brent Daily Spot Prices (Price)
- Pearson correlation (r)
- -0.7366
- Spearman correlation
- -0.719
- p-value
- 0
- Sample size (n)
- 252
- 95% confidence interval
- -0.7884 to -0.6744
- Granger causality
- None
- Granger optimal lag
- 10
AI analysis
Scatterplot Analysis: Brent Crude Oil Prices vs. Cboe U.S. Equities Trade Count (2009)
Relationship Overview
The scatterplot reveals a notable negative relationship between Cboe U.S. equities trade count (Tape A) and Brent crude oil spot prices across 252 trading days in 2009. As equity trade counts increase, Brent crude prices tend to decline, and vice versa. The linear regression equation (y = -23,226.1x + 3,063,290) quantifies this inverse slope, suggesting that for each additional unit increase in trade count (in the relevant scale), oil prices decrease by roughly $23,226 on average. Visually, the data points slope downward from left to right, though with considerable scatter, indicating the relationship is real but far from deterministic.
Correlation Strength and Statistical Significance
The Pearson correlation of r = -0.737 reflects a moderately strong negative association. The coefficient of determination r² = 0.543 means that approximately 54.3% of the variance in Brent crude prices is statistically explained by equity trade volume — a substantial share, though nearly half the variance remains unexplained by this single predictor. The 95% confidence interval of [-0.788, -0.674] is relatively narrow and lies entirely in negative territory, providing strong statistical confidence that the true population correlation is meaningfully negative. The p-value of essentially zero confirms this is not a chance finding given the sample size. However, Granger causality analysis tells a more cautious story: neither direction of causation (X→Y or Y→X) reaches significance (F = 1.51, p = 0.137 and F = 1.20, p = 0.289 respectively), meaning that past values of trade count do not reliably predict future oil prices, and vice versa. The correlation is real, but temporal predictive power is absent.
Notable Patterns, Clusters, and Outliers
Several features stand out in the data. There is a loose clustering of high trade-count observations (X 70) that tend to concentrate at lower Brent price levels (roughly $1.0M–$1.7M range on the Y-axis), consistent with the negative trend. Conversely, lower trade counts (X < 55) are associated with a wider and generally higher spread of Brent prices. A handful of notable outliers are visible: one point near (75.15, 362,081) sits dramatically below the regression line — an extreme low-price observation that likely reflects a specific market disruption or data anomaly. Similarly, points near (42.19, 2,549,192) and (44.99, 2,387,937) represent unusually high price observations at low trade volumes. The scatter also widens at lower X values, hinting at heteroscedasticity — the relationship becomes less precise as trade counts decrease.
Confounding Factors and Interpretation Caveats
This correlation almost certainly reflects shared macroeconomic dynamics rather than a direct causal mechanism. The year 2009 was defined by the aftermath of the global financial crisis, during which equity markets experienced extreme volatility and high trading volumes (panic selling, recovery rallies), while oil prices were simultaneously recovering from their 2008 crash lows. Both variables were likely driven by the same underlying factors — risk sentiment, economic recovery signals, and institutional investor behavior — creating a spurious or confounded correlation. The axis labeling also warrants scrutiny: the dataset metadata appears to swap source attribution (Brent prices listed under Cboe data and vice versa), which should be verified before drawing firm conclusions. Additionally, with N = 3,232 as the population but only n = 252 sampled pairs, any non-random sampling could introduce bias.
Actionable Insights and Further Investigation
Given the absence of Granger causality, practitioners should avoid using equity trade volume as a leading indicator for crude oil price forecasting in isolation. Instead, this relationship is better understood as a coincident signal of broader market conditions. Further investigation should include: (1) controlling for macroeconomic variables such as VIX, USD index, and Fed policy actions that independently drive both markets; (2) extending the time series beyond 2009 to test whether this correlation persists in non-crisis years or is period-specific; (3) investigating the extreme outliers (particularly the near-zero price observation) for data integrity issues; and (4) exploring non-linear models, as the visible heteroscedasticity and outlier structure suggest a simple linear fit may underrepresent the true relationship dynamics.
X dataset: Brent Daily Spot Prices
Y dataset: Cboe U.S. Equities Historical Market Volume Data 2009
Part of experiment: Daily - Brent Daily Spot Prices vs Cboe U.S. Equities Historical Market Volume Data 2009