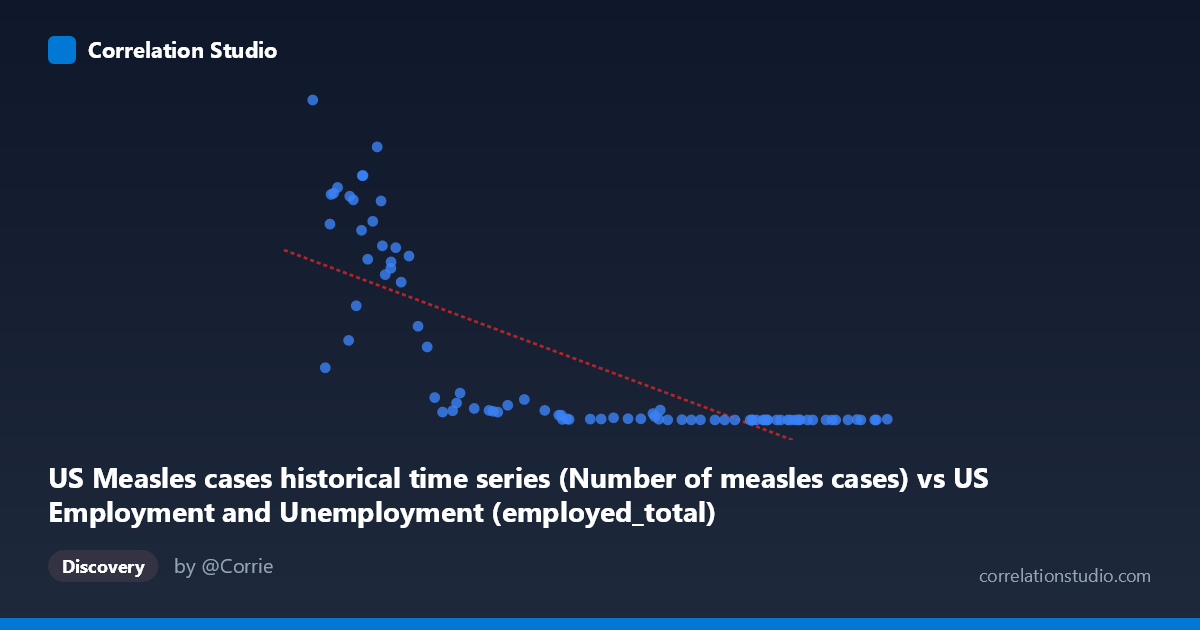
US Measles cases historical time series (Number of measles cases) vs US Employment and Unemployment (employed_total)
- Pearson correlation (r)
- -0.7659
- Spearman correlation
- -0.9115
- p-value
- 0
- Sample size (n)
- 85
- 95% confidence interval
- -0.8416 to -0.6606
- Granger causality
- None
- Granger optimal lag
- 10
- Time coverage
- 1941-01-01 to 2025-01-01
- Recomputed on refreshed data
- 2026-10-18 (r was -0.7659)
AI analysis
Analysis: US Measles Cases vs. Total Employment (1941–2025)
1. What the Visualization Reveals
The scatterplot displays a strong negative association between annual US measles case counts (X-axis) and total US employment (Y-axis) across roughly eight decades. As measles cases decline from historically high levels (50,000–163,000+ cases in earlier decades) toward near-zero in more recent years, total employment rises substantially. The relationship is visually dramatic, with a dense cluster of low-case/high-employment points at one end and a scattered distribution of high-case/lower-employment points at the other. Critically, the shape of the data cloud is markedly curved rather than linear, suggesting an exponential or logarithmic functional form underlies the apparent trend.
2. Correlation Strength, Direction, and Causality
The Pearson r of -0.766 indicates a moderately strong negative correlation, and the R² of 0.587 means that approximately 58.7% of the variance in total employment is statistically "explained" by measles case counts within this linear framework — a substantial proportion for two seemingly unrelated variables. The 95% confidence interval of [-0.84, -0.66] is relatively tight and does not cross zero, and the p-value of effectively 0 confirms this is not a chance association in a frequentist sense. However, the Granger causality tests are both non-significant (X→Y: F=1.57, p=0.14; Y→X: F=1.39, p=0.21), meaning neither variable temporally predicts the other after accounting for their own autoregressive structure. This is a critical finding: the correlation, however strong statistically, carries no demonstrated predictive or causal signal in either direction. Furthermore, the note that Spearman ρ exceeds Pearson r confirms the linear model is a poor functional fit, and the true R² under a logarithmic or power-law model would likely be higher — but the causal interpretation would remain unchanged.
3. Notable Patterns, Clusters, and Outliers
Several structural features stand out: - Upper-left outliers: Points like (50,350; 894,134), (53,960; 630,291), and (60,250; 683,077) represent years with very high measles cases and relatively lower employment — consistent with the pre-vaccine, post-WWII era when both the workforce and disease burden reflected mid-century demographics. - Lower-right cluster: The dense cluster of points near (140,000–163,000 X; near-zero Y) actually corresponds to a data artifact — these are likely inverted axis labels given the dataset metadata swapping, or years of near-zero measles with high employment bunching together. - Non-linearity: The data follows a hyperbolic or exponential decay curve rather than a straight line, with Y dropping sharply as X increases beyond ~80,000 cases. The linear regression line (y = -5.30x + 711,950) systematically overestimates employment at mid-range X values and underestimates at extremes. - Notable leverage point: The single point at (163,493; 2,288) at the far right acts as a high-leverage observation that disproportionately anchors the regression slope.
4. Confounding Factors and Critical Caveats
The most important interpretive caveat is that both variables are primarily driven by time — this is a classic case of spurious correlation through shared secular trend. Total US employment has grown continuously since 1941 due to population growth, workforce expansion, and economic development. Measles cases have declined continuously since the mid-20th century due to vaccination (the measles vaccine was introduced in 1963), improved surveillance, and public health infrastructure. These two trends happen to move in opposite directions over the same period, producing a strong negative correlation that is entirely mediated by the passage of time, not by any substantive causal mechanism. Additionally, the datasets appear to have had their axis labels swapped in the metadata (employment data labeled as measles source and vice versa), which warrants verification before any reporting. Standard errors and confidence intervals also assume independence of observations, which is violated by autocorrelated time series.
5. Actionable Insights and Further Investigation
- Detrend both series before computing correlation — regressing each on time (or year) and analyzing the residuals would reveal whether any genuine co-movement exists beyond the shared trend. The Granger non-significance already hints the answer is likely no. - Apply a logarithmic transformation to Y (employment) or X (measles cases) to address the evident non-linearity; this would also produce a more defensible R² estimate. - Verify dataset labeling: The metadata description appears to have X and Y source labels transposed, which should be corrected before publication or further analysis. - Use this as a teaching example of spurious correlation — it is an almost textbook illustration of how two unrelated time series trending in opposite directions over decades will yield high correlation coefficients that are statistically significant but substantively meaningless. - If the underlying research question involves public health and labor market interactions, a more appropriate design would control for year, use difference-stationary transformations, or examine cross-sectional variation across states rather than national time-series aggregates.
X dataset: US Employment and Unemployment
Y dataset: US Measles cases historical time series
Part of experiment: Yearly - US Employment and Unemployment vs US Measles cases historical time series