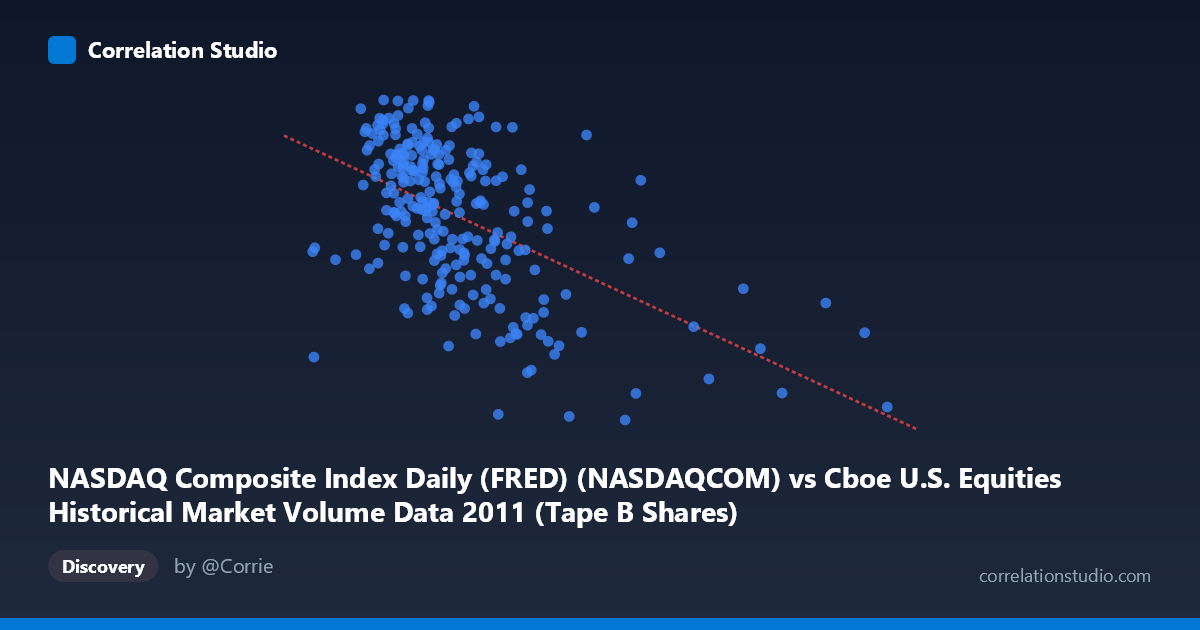
NASDAQ Composite Index Daily (FRED) (NASDAQCOM) vs Cboe U.S. Equities Historical Market Volume Data 2011 (Tape B Shares)
- Pearson correlation (r)
- -0.5343
- Spearman correlation
- -0.5064
- p-value
- 0
- Sample size (n)
- 252
- 95% confidence interval
- -0.6171 to -0.4397
- Granger causality
- None
- Granger optimal lag
- 10
AI analysis
Analysis: NASDAQ Composite Index vs. Cboe Tape B Shares Volume (2011)
Relationship Overview
The scatterplot reveals a moderate negative relationship between the NASDAQ Composite Index level and Cboe Tape B shares volume throughout 2011. As the NASDAQ index rose to higher levels, trading volume in Tape B securities tended to decline, and conversely, periods of lower index values were associated with elevated share volume. This inverse pattern is consistent with well-documented market behavior where heightened uncertainty and price declines drive panic selling and elevated trading activity, while calmer, rising markets see reduced volume as investors hold positions with greater confidence.
Correlation Strength and Statistical Significance
The Pearson correlation of r = -0.5343 reflects a moderate negative association, and the R² of 0.2854 means that roughly 28.5% of the variance in Tape B volume is statistically explained by the NASDAQ index level — leaving approximately 71.5% attributable to other factors. The linear regression slope of approximately -2.0 × 10⁻⁶ suggests that for every 10-million-unit increase in X (NASDAQ composite value), Tape B shares decline by roughly 20 shares on average. The 95% confidence interval of [-0.6171, -0.4397] is meaningfully wide but entirely negative, confirming directional consistency. The p-value of effectively zero, combined with a sample of n = 252 drawn from a population of N = 3,780, provides strong statistical confidence that this negative association is not a sampling artifact. Critically, however, Granger causality tests found no significant temporal predictive relationship in either direction (X→Y: F = 1.74, p = 0.074; Y→X: F = 0.50, p = 0.89), meaning neither variable reliably predicts future movements in the other even at an optimal lag of 10 periods. The correlation is contemporaneous, not predictive.
Notable Patterns and Outliers
Several features stand out in the data. The bulk of observations cluster in the X range of 60–130 million with Y values between approximately 2,500–2,850, forming a diffuse but downward-sloping cloud. There are notable high-volume outliers at lower index values (e.g., points near X = 41–65 million with Y around 2,825–2,870), consistent with the market stress periods of 2011, particularly the August debt-ceiling crisis and European sovereign debt fears that drove both index declines and volume spikes. On the opposite end, high-index, low-volume outliers appear around X = 169–265 million, suggesting that the right tail of the distribution represents calmer, higher-valuation periods with suppressed trading urgency. The scatter is notably wide at mid-range X values, indicating that the relationship is far from deterministic across typical market conditions.
Confounding Factors and Caveats
Several important caveats apply. First, 2011 was an unusually volatile year — the U.S. credit downgrade, flash crash aftershocks, and European contagion fears created episodic volume spikes that may inflate the apparent correlation. This relationship may not generalize to other years. Second, Tape B specifically covers NYSE MKT (AMEX)-listed securities, a subset of the broader equity market; its volume dynamics may reflect sector-specific or listing-venue factors rather than broad market sentiment alone. Third, the direction of the axes deserves scrutiny — the dataset labels suggest the X-axis is NASDAQ composite values from a Cboe volume dataset file, and vice versa, raising potential metadata concerns about variable assignment. Finally, algorithmic and high-frequency trading patterns, settlement cycles, and options expiration dates could introduce systematic volume fluctuations orthogonal to index levels.
Actionable Insights and Further Investigation
Despite the lack of Granger causality, the contemporaneous correlation is strong enough to warrant further investigation. Analysts should consider segmenting the data by market regime (e.g., trending vs. mean-reverting periods, pre- and post-August 2011 crisis) to determine whether the correlation is driven primarily by stress episodes. Incorporating VIX or implied volatility as a mediating variable would help test whether market fear, rather than the index level itself, is the true driver of elevated Tape B volume. It would also be valuable to replicate this analysis across multiple years to assess whether 2011's structural volatility produced an anomalously strong inverse relationship. Finally, given the Granger null result, practitioners should avoid using either variable alone for short-term forecasting; instead, ensemble models incorporating volume, volatility, and macro indicators would be more appropriate for predictive applications.
X dataset: Cboe U.S. Equities Historical Market Volume Data 2011
Y dataset: NASDAQ Composite Index Daily (FRED)
Part of experiment: Daily - Cboe U.S. Equities Historical Market Volume Data 2011 vs NASDAQ Composite Index Daily (FRED)