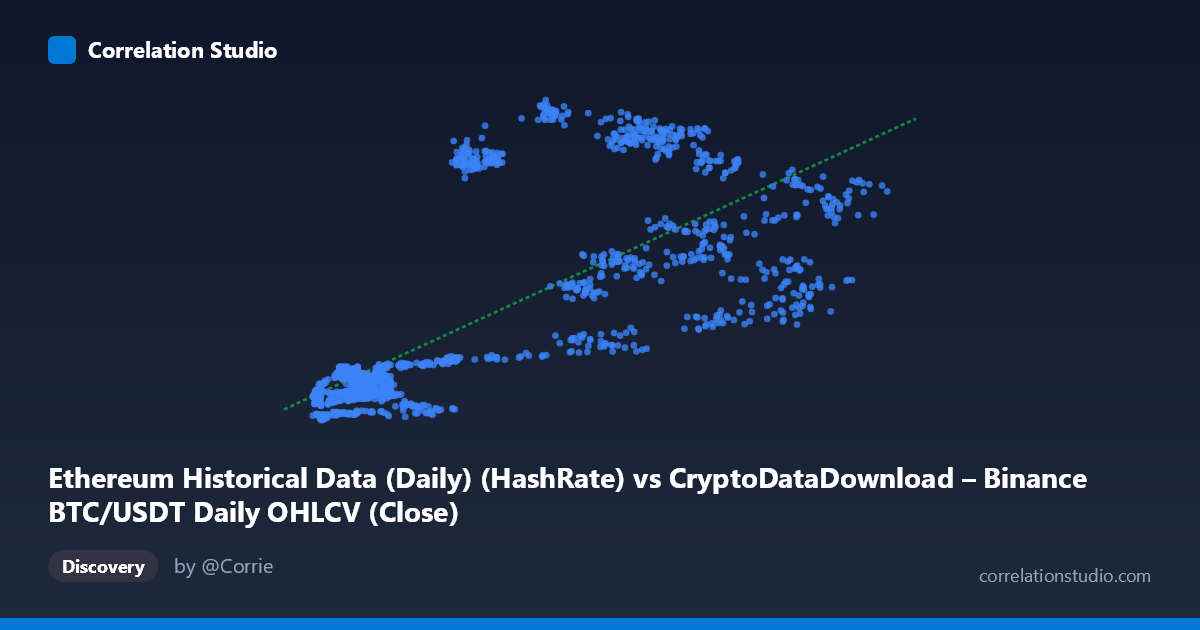
Ethereum Historical Data (Daily) (HashRate) vs CryptoDataDownload – Binance BTC/USDT Daily OHLCV (Close)
- Pearson correlation (r)
- 0.7489
- Spearman correlation
- 0.7536
- p-value
- 0
- Sample size (n)
- 1855
- 95% confidence interval
- 0.7282 to 0.7682
- Granger causality
- None
- Granger optimal lag
- 1
AI analysis
Analysis of the Ethereum Hash Rate vs. BTC/USDT Close Price Relationship
1. Overview of the Relationship
The scatterplot shows a positive, moderately strong association between the X variable (labeled as Ethereum hash rate, though the mapping between axis labels and dataset descriptions appears mismatched/mislabeled in the metadata) and the Y variable. As X increases from roughly 3,000 to 68,000, Y trends upward from double digits into the 800–1,000+ range. However, the relationship is not tightly linear — there's considerable vertical spread at nearly every X value, especially in the 20,000–50,000 range, where Y values fan out anywhere from ~270 to ~1,000+.
2. Correlation Strength and Statistical Confidence
The Pearson correlation of r = 0.749 indicates a moderately strong positive linear relationship, with r² = 0.561 meaning only about 56% of the variance in Y is explained by X — leaving nearly 44% attributable to other factors, noise, or nonlinear dynamics not captured by this simple linear model. The 95% confidence interval [0.728, 0.768] is narrow, and the p-value of ~0 confirms this correlation is highly statistically significant and not due to chance, aided by the large sample size (n=1,855). However, statistical significance should not be conflated with practical predictive strength — a 56% variance explanation leaves substantial room for error in any point forecast. Critically, the Granger causality tests show no significant predictive direction in either direction (X→Y: p=0.297; Y→X: p=0.530), meaning that despite the strong contemporaneous correlation, neither variable's past values reliably help forecast the other's future values at a 1-period lag. This suggests the relationship may be driven by a shared underlying trend (e.g., both series responding to broader market cycles) rather than one variable mechanically leading the other.
3. Notable Patterns and Outliers
The data reveals at least two distinct behavioral regimes: a tight, low-variance cluster at low X (roughly X < 15,000, Y < 250) that behaves almost linearly and with low scatter, and a much more dispersed, higher-variance regime at higher X values (X 18,000) where Y ranges wildly from ~270 to over 1,000 for similar X values. This suggests a possible regime shift or structural break — potentially corresponding to a specific time period (e.g., a bull market run) where Y decoupled from its earlier tight relationship with X. Points like (30293.94, 1016.21) and (18970.79, 939.71) sit well above the general trend line, while (35828.61, 309.41) and (23821.61, 269.42) sit far below it despite similar X values, indicating that time-based or cyclical factors are likely superimposed on the X-Y relationship.
4. Confounding Factors and Caveats
Both variables are derived from cryptocurrency market/network data spanning 2017–2022, a period marked by extreme volatility, multiple bull/bear cycles, and macro shocks (e.g., COVID-19, 2021 bull run, 2022 crash). Since both hash rate/network metrics and price series tend to trend upward together during bull markets (common trend/non-stationarity), the correlation may be substantially inflated by shared time-trend rather than direct causal linkage. Neither series appears to have been differenced or detrended, which is a classic source of spurious correlation between two non-stationary time series. Additionally, the dataset metadata itself contains inconsistencies (the X-axis and Y-axis descriptions reference overlapping/swapped dataset labels), suggesting some caution is warranted regarding data provenance and correct variable identification.
5. Recommendations for Further Investigation
Given the lack of Granger causality despite significant contemporaneous correlation, analysts should test the relationship on differenced or log-returns data rather than levels, to check whether the correlation persists after removing shared trends (a cointegration test would also be valuable here). It would also help to segment the data by time period or market regime (bull vs. bear phases) to see if the r² is much higher within regimes than across the full dataset — this could confirm the suspected structural break around X≈15,000–20,000. Finally, clarifying the true variable identities (resolving the metadata mismatch) is essential before drawing any domain-specific conclusions about hash rate and price dynamics.
X dataset: CryptoDataDownload – Binance BTC/USDT Daily OHLCV
Y dataset: Ethereum Historical Data (Daily)
Part of experiment: Bitcoin - CryptoDataDownload – Binance BTC/USDT Daily OHLCV vs Ethereum Historical Data (Daily)