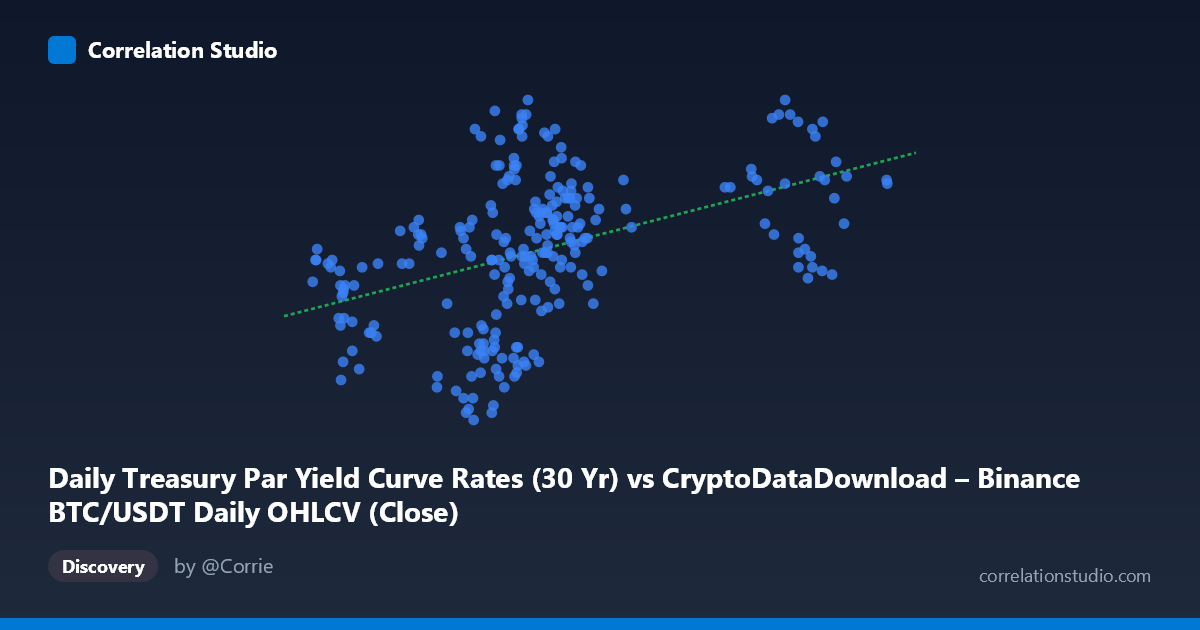
Daily Treasury Par Yield Curve Rates (30 Yr) vs CryptoDataDownload – Binance BTC/USDT Daily OHLCV (Close)
- Pearson correlation (r)
- 0.4368
- Spearman correlation
- 0.5076
- p-value
- 0
- Sample size (n)
- 250
- 95% confidence interval
- 0.3306 to 0.532
- Granger causality
- None
- Granger optimal lag
- 1
AI analysis
Analysis: Treasury 30Yr Yield vs. BTC/USDT Close
(Note: the axis labels appear swapped in the metadata — the "30 Yr Treasury Yield" values range 3.94–4.82, consistent with a yield in percentage terms, while the 39,568–106,133 range matches BTC/USDT closing prices. The analysis below treats X = BTC/USDT Close and Y = 30Yr Treasury Yield, per the actual data ranges.)
1. What the Visualization Reveals The scatterplot shows a positive but noisy relationship between BTC/USDT closing price and the 30-year Treasury yield across 2024. As BTC price rises from the high-30k/40k range toward 100k+, yields show a modest upward drift, but the cloud of points is wide and dispersed rather than tightly banded, indicating substantial scatter around any fitted trend line.
2. Strength, Direction, and Statistical Confidence The correlation coefficient (r = 0.437) indicates a moderate positive relationship, with r² = 0.191 meaning only about 19% of the variance in yield is statistically associated with BTC price — the remaining ~81% is driven by other factors. The 95% CI [0.331, 0.532] is reasonably tight and entirely positive, and the p-value (4.5×10⁻¹³) confirms this correlation is highly unlikely to be due to chance in this sample. However, statistical significance with large N should not be conflated with practical/predictive strength — r² of 0.19 is a weak-to-moderate explanatory relationship, not a tight coupling. Critically, the Granger causality tests show no significant predictive direction in either direction (BTC→Yield: p=0.408; Yield→BTC: p=0.128), meaning neither series reliably leads the other in time. This suggests the correlation is likely driven by both series responding to shared macro conditions (e.g., risk sentiment, Fed policy expectations, liquidity regime) rather than one causing the other.
3. Patterns, Clusters, and Outliers The data shows a distinct clustering structure: a dense cluster of points in the 55k–70k BTC price range with yields spanning almost the full 3.94–4.78 range, and a sparser cluster in the 87k–106k range with yields more concentrated around 4.4–4.8. This bimodal clustering (rather than a smooth continuum) suggests two distinct market regimes in 2024 — likely an early/mid-year consolidation phase and a later rally phase — rather than a continuous linear relationship. Within the lower cluster, yield varies widely (3.94 to 4.78) for similar BTC prices (~57k–69k), indicating high noise/low signal in that regime specifically. The relationship may be more of a regime-shift artifact (both variables trending upward over the year) than genuine point-to-point correlation.
4. Confounding Factors and Caveats This is a classic time-series confounding risk: both BTC price and Treasury yields exhibited independent upward trends over 2024 (BTC due to ETF flows/halving cycle dynamics, yields due to Fed policy and fiscal/inflation expectations). Correlating two trending series over time can produce spurious statistical correlation even absent any causal link — the Granger test's null result reinforces this concern. Additional confounders include: macro liquidity conditions, dollar strength (DXY), equity market risk appetite (SPX/Nasdaq), inflation prints, and Fed rate decisions — all of which could simultaneously influence both crypto risk assets and long-duration Treasury yields. Daily closing price alignment across different market hours (24/7 crypto vs. bond market close) may also introduce timing/lag noise.
5. Suggestions for Further Investigation To distinguish genuine relationship from shared-trend artifact, analysts should: (1) detrend or difference both series (e.g., use daily returns/changes rather than levels) and re-test correlation; (2) include control variables like DXY, S&P 500, and VIX in a multivariate regression to isolate BTC's independent effect on yields; (3) test cointegration (e.g., Engle-Granger) given both are trending non-stationary series; and (4) segment the analysis by the two apparent regimes (sub-70k vs. 87k+) to check if the relationship is regime-dependent or an artifact of clustering. Given the non-significant Granger causality, this correlation should not be used for predictive trading signals in either direction without further validation.
X dataset: CryptoDataDownload – Binance BTC/USDT Daily OHLCV
Y dataset: Daily Treasury Par Yield Curve Rates
Part of experiment: Bitcoin - CryptoDataDownload – Binance BTC/USDT Daily OHLCV vs Daily Treasury Par Yield Curve Rates