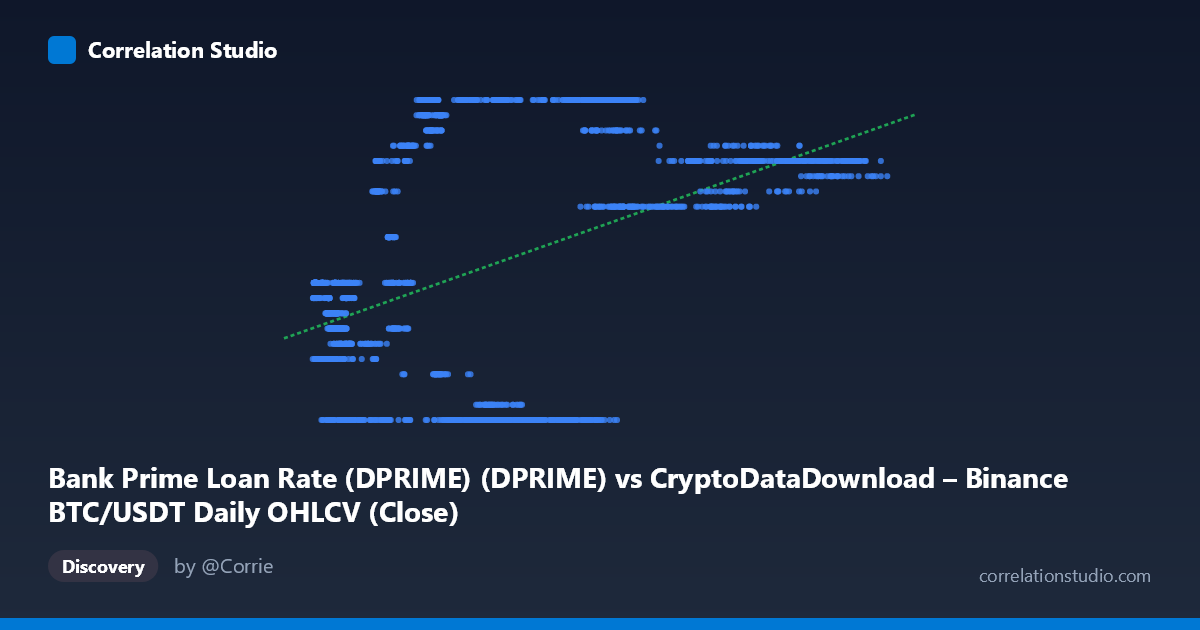
Bank Prime Loan Rate (DPRIME) (DPRIME) vs CryptoDataDownload – Binance BTC/USDT Daily OHLCV (Close)
- Pearson correlation (r)
- 0.4675
- Spearman correlation
- 0.35
- p-value
- 0
- Sample size (n)
- 2227
- 95% confidence interval
- 0.4344 to 0.4994
- Granger causality
- None
- Granger optimal lag
- 1
- Time coverage
- 2017-08-17 to 2026-06-25
- Recomputed on refreshed data
- 2026-10-23 (r was 0.4675)
AI analysis
Analysis: Bank Prime Loan Rate vs. BTC/USDT Close Price
Note on axis labeling: The variable labels appear swapped in the metadata — the values (3.25–8.50) with discrete steps clearly represent the Bank Prime Loan Rate (Y-axis, as typically plotted), while the continuous, wide-ranging values (3,189–124,658) represent BTC/USDT Close price (X-axis). This is consistent with how prime rates move in discrete Fed-driven steps (3.25%, 3.50%, 4.75%, 5.00%, 6.75%, 7.75%, 8.50%, etc.) while BTC price is continuous. The analysis below treats X = BTC Price and Y = Prime Rate accordingly.
1. What the Visualization Reveals The scatterplot shows a weak-to-moderate positive association between BTC/USDT price and the prime rate. Rather than a smooth cloud, the data forms horizontal bands at fixed rate levels (3.25, 5.00, 6.75, 7.75, 8.50, etc.), reflecting the step-function nature of Fed rate policy. Within each band, BTC prices vary widely, indicating that price alone is a poor predictor of which rate regime is in effect — the relationship is more a byproduct of shared time trends than a direct causal link.
2. Strength, Direction, and Statistical Confidence The correlation coefficient (r = 0.467) indicates a weak-to-moderate positive relationship, with R² = 0.218 meaning only 21.8% of the variance in the prime rate is explained by BTC price (or vice versa) — leaving ~78% unexplained by this bivariate relationship. The 95% CI [0.434, 0.499] is fairly narrow given the large sample (n=2,221), and the p-value ≈ 0 confirms the correlation is statistically significant and not due to chance. However, statistical significance ≠ practical strength — with R² this low, the relationship has limited predictive utility. Critically, the Granger causality tests show no significant predictive direction in either direction (X→Y: p=0.184; Y→X: p=0.438), meaning neither variable's past values help forecast the other's future values at a 1-period lag. This strongly suggests the correlation is not causal but likely driven by both series independently trending upward over the same 2017–2026 window (a classic case of spurious correlation via shared time trend).
3. Notable Patterns and Outliers - Discrete banding: The rate variable clusters into ~7-8 fixed levels, creating horizontal stripes rather than a continuous scatter. - Wide dispersion within bands: At rate = 3.25, BTC prices range from ~6,800 to ~63,000 — a massive spread, undermining any tight linear relationship at the low end. - High-rate/high-price clustering: The 7.75–8.50 band tends to associate with higher BTC prices (30,000–120,000+), suggesting this cluster is disproportionately pulling the correlation positive — likely reflecting 2023–2025 data where both BTC price and rates rose post-pandemic. - Low-price/rate 5.00 cluster: A tight group of points near (6,000–10,000, 5.00) appears to be an early-dataset (2017–2018) cluster with limited variance, potentially exerting leverage on the regression line.
4. Confounders and Caveats - Time is the dominant confound: Both series are non-stationary time series that trended over the 2017–2026 period (BTC price generally rising with volatility; prime rate rising from post-2008 lows through the 2022–2023 hiking cycle). Correlating two trending series without differencing/detrending will produce inflated, spurious r values. - Non-independence of observations: Daily financial/macro data exhibits strong autocorrelation, violating the i.i.d. assumption behind standard p-value calculations — the true effective sample size is much smaller than n=2,221, meaning statistical significance is likely overstated. - Discrete vs. continuous variable mismatch: Prime rate changes ~8-10 times over the sample period while BTC trades continuously; this structural mismatch limits meaningful linear correlation analysis. - N vs. n discrepancy (3,212 vs. 2,221): ~31% of potential paired observations are missing, possibly from misaligned dates between crypto (365 days/year) and FRED (business days) data.
5. Recommendations for Further Investigation 1. Detrend or difference both series (e.g., use % change in BTC price and rate changes) before correlating, to remove spurious trend-driven correlation. 2. Test cointegration (e.g., Engle-Granger) rather than raw correlation, given both are trending time series. 3. Segment by rate regime (e.g., analyze BTC price behavior separately within each fixed-rate period) to see if rate changes (not levels) coincide with BTC volatility or regime shifts. 4. Extend Granger lag structure beyond 1 period — macro policy effects on risk assets often manifest with longer lags (3-12 months). 5. Given the lack of Granger causality and low R², treat this relationship as descriptive/coincidental rather than predictive for trading or policy models — a multivariate approach including inflation, DXY, or liquidity measures would likely offer more explanatory power.
X dataset: CryptoDataDownload – Binance BTC/USDT Daily OHLCV
Y dataset: Bank Prime Loan Rate (DPRIME)
Part of experiment: Bitcoin - CryptoDataDownload – Binance BTC/USDT Daily OHLCV vs Bank Prime Loan Rate (DPRIME)