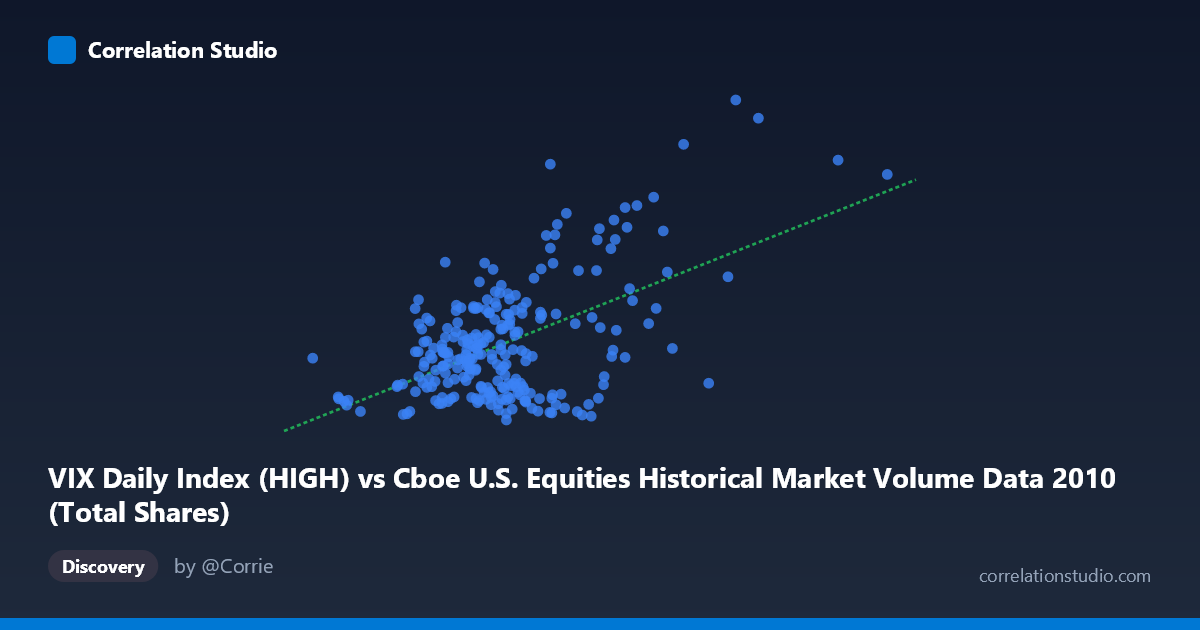
VIX Daily Index (HIGH) vs Cboe U.S. Equities Historical Market Volume Data 2010 (Total Shares)
- Pearson correlation (r)
- 0.5343
- Spearman correlation
- 0.2841
- p-value
- 0
- Sample size (n)
- 252
- 95% confidence interval
- 0.4397 to 0.6171
- Granger causality
- Y → X
- Granger optimal lag
- 1
AI analysis
Scatterplot Analysis: VIX High vs. Total Market Volume (2010)
Relationship Overview
The scatterplot reveals a moderate positive relationship between the CBOE VIX Daily High Index and total U.S. equity market shares traded throughout 2010. As VIX readings rise — indicating heightened market fear or uncertainty — trading volume tends to increase correspondingly. This is economically intuitive: periods of elevated volatility typically drive both reactive institutional rebalancing and retail panic selling or buying, inflating share turnover. The linear regression equation (y = 1.63×10⁻⁸x + 12.97) confirms the positive slope, though the wide dispersion around the regression line is immediately apparent, signaling that the relationship is real but far from deterministic.
Correlation Strength and Statistical Significance
The Pearson correlation of r = 0.534 represents a moderate positive association, but the explained variance metric tells a more sobering story: r² = 0.285, meaning VIX highs account for only about 28.5% of the variance in total shares traded. The remaining ~71.5% is driven by factors outside this model. The 95% confidence interval of [0.440, 0.617] is meaningfully bounded away from zero, and the p-value of effectively 0 (given N = 3,302) confirms this is not a chance finding. Critically, the Granger causality results point unidirectionally: Y Granger-causes X (F = 4.99, p = 0.026), meaning past VIX highs statistically predict future trading volume, but not vice versa (F = 2.47, p = 0.117). This implies that volatility sentiment leads market activity rather than the reverse — fear precedes volume surges by approximately one trading period.
Notable Patterns, Clusters, and Outliers
The data display a distinct bimodal or heteroskedastic structure. A dense, low-volatility cluster occupies the lower-left region (VIX High roughly 16–25, volume ~400M–750M shares), representing the relatively calm stretches of 2010 trading. A second, sparser cluster fans upward and rightward at elevated VIX levels (30), where volume variability widens dramatically — consistent with volatility-induced volume spikes being irregular and episodic. Several prominent outliers deserve attention: the points near (1,476,964K volume, VIX ~42) and (1,225,973K volume, VIX ~48) are particularly extreme, likely corresponding to specific macro shock events in 2010 (e.g., the May 6 Flash Crash or European sovereign debt escalations). Point (1,098,045K, ~43.7) similarly sits far from the main cluster. These outliers exert disproportionate leverage on the regression fit and likely inflate the correlation estimate.
Confounding Factors and Caveats
Several important caveats apply. First, reverse causality cannot be fully dismissed despite the Granger result — algorithmic trading systems respond to volume signals in ways that can feed back into volatility measures within the same session. Second, the VIX is a forward-looking implied volatility measure derived from options pricing, while total shares traded reflects realized activity; these are conceptually distinct constructs. Third, secular intraday and day-of-week effects in volume (e.g., Mondays and Fridays systematically differ) may create spurious co-movement with VIX if volatility also varies seasonally. Fourth, the 2010 sample includes the Flash Crash (May 6), an extraordinary structural event that may not generalize to other periods, and its outlier points could be distorting the overall r estimate substantially.
Actionable Insights and Further Investigation
Practitioners monitoring market microstructure or liquidity risk should note that VIX readings above ~30 appear to be a threshold beyond which volume behavior becomes substantially more erratic and unpredictable — a useful signal for risk management. The one-period Granger lead suggests that elevated VIX readings today could serve as a next-day volume surge warning, potentially informing execution strategy and transaction cost modeling. For further investigation, it would be valuable to: (1) re-run the analysis excluding Flash Crash days to assess their distorting influence; (2) segment by exchange or trade type (lit vs. dark pool) to see if the VIX-volume relationship is concentrated in specific venues; (3) test non-linear models (e.g., piecewise regression with a breakpoint around VIX = 25–30) given the apparent heteroskedasticity; and (4) incorporate additional predictors such as realized volatility, bid-ask spreads, or macroeconomic news indicators to build a more complete model of the remaining 71.5% unexplained variance.
X dataset: Cboe U.S. Equities Historical Market Volume Data 2010
Y dataset: VIX Daily Index
Part of experiment: Daily - Cboe U.S. Equities Historical Market Volume Data 2010 vs VIX Daily Index