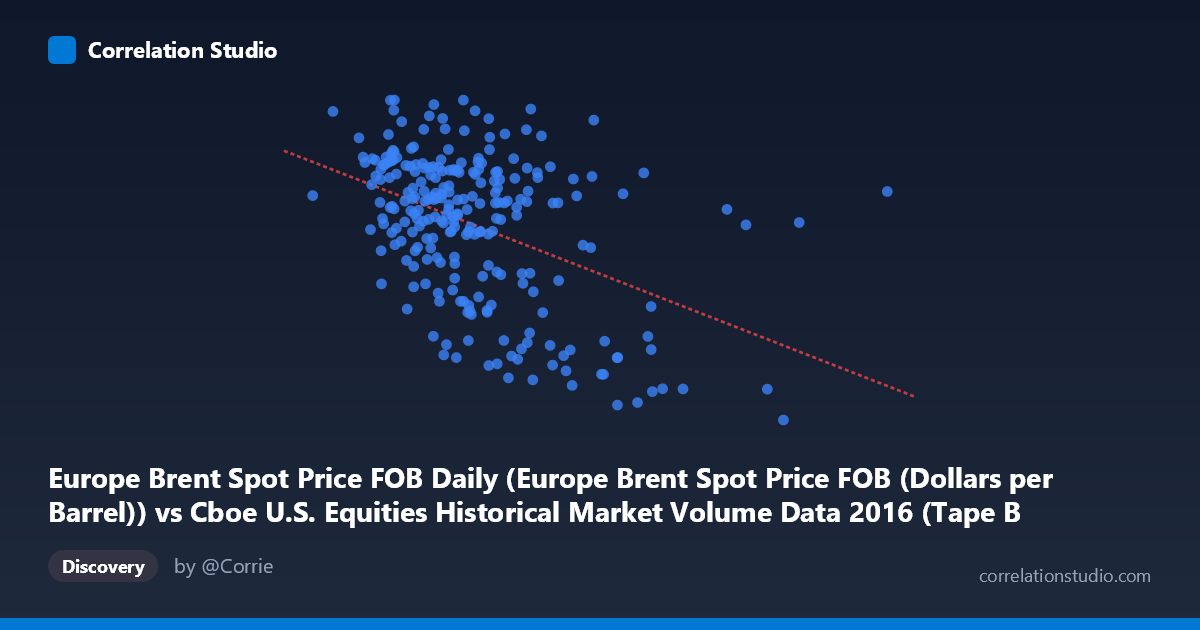
Europe Brent Spot Price FOB Daily (Europe Brent Spot Price FOB (Dollars per Barrel)) vs Cboe U.S. Equities Historical Market Volume Data 2016 (Tape B Notional)
- Pearson correlation (r)
- -0.4436
- Spearman correlation
- -0.3913
- p-value
- 0
- Sample size (n)
- 251
- 95% confidence interval
- -0.5379 to -0.3384
- Granger causality
- None
- Granger optimal lag
- 1
AI analysis
Analysis: Europe Brent Spot Price vs. Cboe Tape B Notional Value (2016)
Relationship Overview The scatterplot reveals a moderate negative relationship between Europe Brent crude oil spot prices (X-axis, in dollars per barrel) and Cboe Tape B notional trading volume (Y-axis, in billions). As oil prices increase, Tape B notional value tends to decline. The linear regression equation (y = -1.899×10⁻⁹x + 53.26) captures this downward slope, suggesting that higher oil price environments in 2016 coincided with reduced notional trading activity in Tape B securities. This is a somewhat counterintuitive pairing at first glance, but reflects broader market dynamics where commodity price regimes can influence equity market behavior.
Correlation Strength and Statistical Significance The Pearson correlation of r = -0.44 indicates a moderate negative association, though the R² of 0.197 means that only about 19.7% of the variance in Tape B notional value is explained by oil prices — leaving roughly 80% attributable to other factors. The 95% confidence interval of [-0.54, -0.34] is comfortably negative and does not include zero, and the p-value of 1.58×10⁻¹³ confirms the relationship is highly statistically significant given n=251 sampled from a population of 3,622 trading days. However, statistical significance should not be conflated with practical importance. Critically, Granger causality tests in both directions are non-significant (X→Y: F=0.47, p=0.49; Y→X: F=0.35, p=0.55), meaning neither variable meaningfully predicts the other in the next period. This strongly suggests the correlation is associative rather than temporally predictive, and likely reflects shared responses to common macroeconomic drivers.
Notable Patterns, Clusters, and Outliers The data reveals a distinct clustering of observations in the mid-range oil price zone (~$35–$55/barrel) with Tape B values concentrated between approximately 40–54 billion, forming a relatively dense central mass. However, there are notable outliers at the high end of the X-axis: points near $80–$127/barrel (particularly the point at ~$10.8B on the X-axis with Y=26.01, and points near $8B with Y values of ~27–28) pull the regression line downward considerably. These extreme X-values appear to be a small cluster of anomalous or legacy oil price observations that may not be representative of 2016 trading conditions, given that the dataset's stated time coverage is 2016 and Brent prices stayed mostly between $27–$57/barrel that year. These outliers may be data artifacts or misaligned records and disproportionately influence the correlation coefficient.
Confounding Factors and Caveats Several important caveats apply here. First, the X and Y axis dataset labels appear to be swapped in the metadata (the Cboe dataset column is described under the Y-axis label and vice versa), which warrants careful verification before drawing firm conclusions. Second, both variables are likely co-driven by macroeconomic regime shifts in 2016 — including the oil price recovery from January lows, the Brexit shock in June, and the U.S. election in November — making it difficult to isolate any direct causal mechanism. Third, Tape B specifically covers NYSE American and regional exchange listings, which may include energy-sector equities, introducing a potential domain overlap with oil prices rather than a truly independent relationship. Finally, the presence of extreme outlier X-values ($70/barrel) that fall well outside 2016 price ranges suggests possible data quality or alignment issues that could artificially inflate the negative correlation.
Actionable Insights and Further Investigation Given the non-significant Granger causality, practitioners should not use oil prices as a leading indicator for Tape B trading volume in short-term trading strategies. Further investigation should prioritize: (1) auditing the outlier data points at X $70/barrel to determine if they represent data entry errors or records from outside the stated 2016 time window; (2) segmenting the analysis by quarter to determine whether the correlation strengthens or reverses during specific macro events like the oil price recovery or the election; (3) testing alternative confounders such as VIX (volatility index), overall market volume, or energy sector index returns; and (4) exploring non-linear modeling (e.g., a segmented or polynomial regression) since the relationship appears to have a tighter band in the mid-price range and breaks down at extremes. A multivariate approach controlling for market-wide volume would better isolate any genuine oil-price-specific effect on Tape B activity.
X dataset: Cboe U.S. Equities Historical Market Volume Data 2016
Y dataset: Europe Brent Spot Price FOB Daily
Part of experiment: Daily - Cboe U.S. Equities Historical Market Volume Data 2016 vs Europe Brent Spot Price FOB Daily