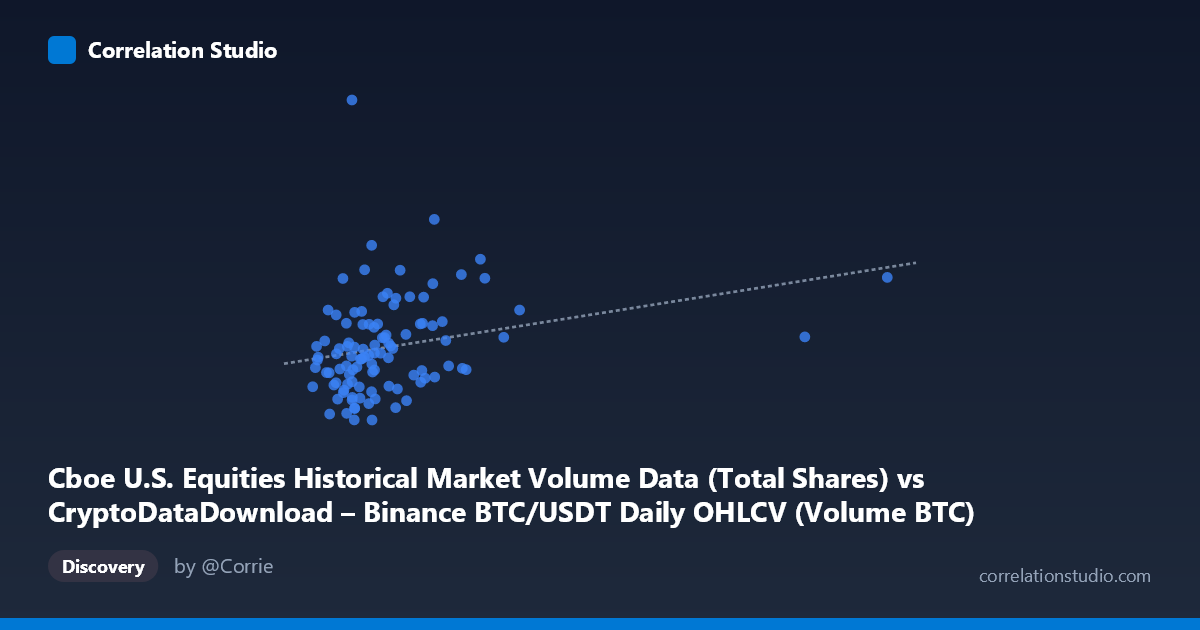
Cboe U.S. Equities Historical Market Volume Data (Total Shares) vs CryptoDataDownload – Binance BTC/USDT Daily OHLCV (Volume BTC)
- Pearson correlation (r)
- 0.258
- Spearman correlation
- 0.343
- p-value
- 0.008201
- Sample size (n)
- 104
- 95% confidence interval
- 0.0688 to 0.4292
- Granger causality
- None
- Granger optimal lag
- 10
AI analysis
Analysis: Cboe U.S. Equities Volume vs. Binance BTC/USDT Volume
1. Overview of the Relationship
The scatterplot displays a weak-to-moderate positive relationship between the two variables. Most data points cluster tightly in the lower-left region (X between ~10,000–30,000; Y between ~800M–1.1B), with a sparse scattering of higher-X outliers (notably points near 92,500 and 106,300) extending the range but not clearly tightening the linear pattern. The bulk of the data shows substantial vertical spread at any given X value, indicating that knowing X alone provides limited predictive power for Y.
2. Strength, Direction, and Statistical Confidence
The correlation coefficient (r = 0.4145) indicates a weak-to-moderate positive linear relationship. Critically, r² = 0.1718 means only 17.2% of the variance in Y is explained by X — the remaining ~83% is driven by other factors, noise, or non-linear dynamics not captured here. While the p-value (4.885E-05) confirms this correlation is statistically significant (unlikely due to random chance in this sample), the 95% CI [0.227, 0.572] is fairly wide, reflecting real uncertainty about the true population-level strength of this relationship — it could be anywhere from weak to moderately strong.
Importantly, the Granger causality tests show no significant predictive direction in either direction (X→Y: p=0.903; Y→X: p=0.758). This means that past values of Cboe equities volume do not help forecast future Binance BTC/USDT volume, and vice versa. Combined with the modest r², this suggests the correlation may reflect a shared external driver (e.g., overall market risk sentiment, macro volatility regimes) rather than any direct or lagged causal linkage between crypto and traditional equity trading volumes.
3. Notable Patterns and Outliers
- Dense cluster: The vast majority of points (X < 30,000) form a loosely upward-sloping cloud, but with high dispersion in Y (ranging from ~780M to ~1.22B) at similar X values — suggesting weak local correlation. - Sparse high-X outliers: Points like (106298.83, 1201438633.50) and (92539.22, 1024404547.85) are far outside the typical X range and could be exerting outsized leverage on the regression slope and r estimate. - No clear non-linear curvature is evident; the relationship, where it exists, appears roughly linear rather than exponential or logarithmic. - Some high-Y points (e.g., ~1.14–1.26B) occur across a wide range of X values (22,000 to 39,000), suggesting Y spikes may be driven by independent volatility events (e.g., BTC price shocks) unrelated to Cboe volume.
4. Confounding Factors and Caveats
- Leverage/outlier sensitivity: With only 90 points and a couple of high-X outliers, the regression line and r may be disproportionately influenced by a handful of extreme observations. Removing them could meaningfully shift r² and the slope. - Time-based confounding: Both series may be responding to common macro-financial conditions (e.g., risk-on/risk-off sentiment, volatility indices like VIX, or macroeconomic news) rather than any direct mechanical link between Binance BTC volume and Cboe equities volume. - Different market structures: Crypto markets (24/7, decentralized) and traditional equities markets (session-based, regulated) have fundamentally different trading calendars and participant bases, undermining the plausibility of a direct causal link. - Non-stationarity: Both time series likely trend over time (volume growth, structural shifts), which can inflate correlation coefficients even absent a true relationship — a classic spurious correlation risk with financial time series.
5. Suggested Next Steps
- Test with detrended/differenced data: Re-run correlation and Granger causality on percentage changes or log returns rather than levels, to rule out spurious correlation from shared trends. - Introduce a common macro variable: Add controls such as overall market volatility (VIX), BTC price volatility, or interest rate regime to see if the correlation persists or disappears (suggesting confounding). - Outlier robustness check: Re-compute r and regression excluding the extreme high-X points to verify the correlation isn't an artifact of a few observations. - Segment by regime: Explore whether the relationship strengthens during specific market stress periods (e.g., high volatility months) versus calm periods, which could reveal conditional rather than constant correlation. - Practical takeaway: Given the lack of Granger causality and modest r², this relationship should not be used for cross-market volume forecasting; it's more likely a coincidental co-movement reflecting broader market-wide trading activity trends during the observed 2026 window.
X dataset: CryptoDataDownload – Binance BTC/USDT Daily OHLCV
Y dataset: Cboe U.S. Equities Historical Market Volume Data
Part of experiment: Bitcoin - CryptoDataDownload – Binance BTC/USDT Daily OHLCV vs Cboe U.S. Equities Historical Market Volume Data