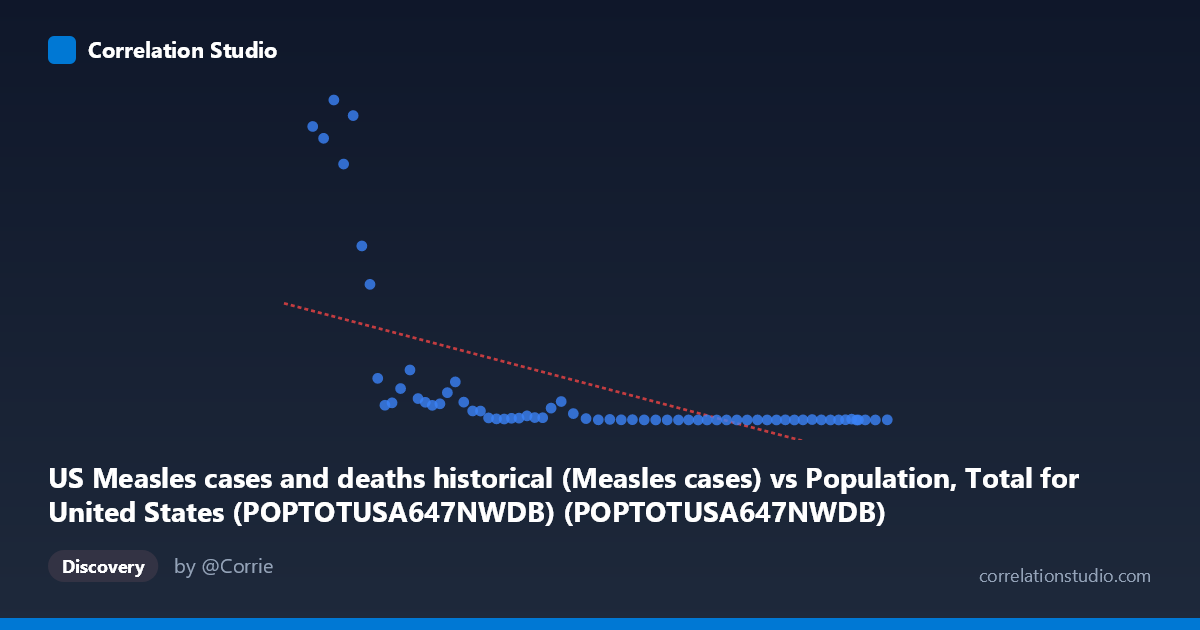
US Measles cases and deaths historical (Measles cases) vs Population, Total for United States (POPTOTUSA647NWDB) (POPTOTUSA647NWDB)
- Pearson correlation (r)
- -0.577
- Spearman correlation
- -0.8712
- p-value
- 0
- Sample size (n)
- 65
- 95% confidence interval
- -0.7196 to -0.3876
- Granger causality
- None
- Granger optimal lag
- 10
- Time coverage
- 1960-01-01 to 2024-01-01
- Recomputed on refreshed data
- 2026-10-17 (r was -0.577)
AI analysis
Analysis of US Population vs. Measles Cases (1960–2024)
1. What the Visualization Reveals
The scatterplot displays a clear negative relationship between US total population (X-axis) and annual measles case counts (Y-axis) over the period 1960–2024. As population grew from roughly 181 million to 340 million, measles cases declined dramatically — from hundreds of thousands annually in the early 1960s to near-zero by the later decades. This inverse trajectory is not coincidental but reflects the sweeping impact of the measles vaccine, introduced in 1963 and expanded through national immunization programs. The chart effectively visualizes a public health transformation compressed into a single temporal arc, where time is the hidden backbone linking both variables.
2. Correlation Strength, Direction, and Statistical Framing
The Pearson correlation of r = -0.577 confirms a moderate-to-strong negative association, but the explanatory power is more sobering: r² = 0.333, meaning population size accounts for only about 33% of the variance in measles cases. The remaining ~67% is explained by other factors entirely. The 95% confidence interval of [-0.720, -0.388] is entirely negative and reasonably tight, giving strong statistical confidence in the direction of the relationship, and the p-value of 4.88 × 10⁻⁷ confirms this is not a chance finding in a sample of 65 annual observations. However, the Granger causality tests are non-significant in both directions (X→Y: p = 0.144; Y→X: p = 0.295), meaning that population growth does not temporally predict changes in measles incidence, nor vice versa. This is a critical caveat: the correlation exists, but there is no evidence of a predictive causal mechanism flowing between these two specific variables across time lags.
3. Notable Patterns, Clusters, and Non-Linearity
The data points form a distinctly non-linear, hyperbolic curve rather than a straight line. A dense high-Y cluster appears at the left side of the X-axis (populations ~181–210 million, roughly the 1960s), where measles cases range from ~22,000 to over 481,000 — extreme outliers by modern standards. The most prominent outliers include observations near (186.5M, 481,530) and (191.9M, 458,083), representing pre-vaccine peak years. As population crosses approximately 230–250 million (mid-1970s onward), the Y-values collapse sharply toward near-zero, clustering tightly along the X-axis baseline regardless of further population growth. This compression strongly suggests a logarithmic or power-law decay rather than a linear relationship — consistent with the note that Spearman ρ exceeds Pearson r, confirming non-linearity. The linear regression line (y = -0.00144x + 424,013) likely fits the early high-case era reasonably but systematically underestimates how rapidly cases dropped and overestimates modern case counts.
4. Confounding Factors and Interpretive Caveats
The most significant confound here is time itself. Both variables are time-indexed annual series, and the apparent correlation is largely an artifact of two independent trends running in opposite directions over the same era: monotonically increasing population and a one-time, near-irreversible collapse in measles incidence driven by vaccination policy, not population size. Population is acting as a crude proxy for time, not as a mechanistic driver. Additional confounders include herd immunity thresholds, changes in surveillance and reporting methodology, school vaccination mandates, the 1989–1991 measles resurgence (visible as a mid-range anomaly), and international importation events. The Granger non-causality result reinforces this: knowing today's population tells you nothing predictive about tomorrow's measles burden beyond what the calendar year already tells you.
5. Actionable Insights and Further Investigation
The most important next step is to replace raw population with vaccination coverage rates (e.g., MMR dose 1 coverage among 2-year-olds, available from CDC since the early 1970s) as the primary X-variable — this would almost certainly yield a far stronger and more mechanistically meaningful negative correlation. Researchers should also consider fitting a non-linear model (logarithmic or exponential decay) to better capture the hyperbolic shape of the decline, which would improve r² substantially beyond the current 33.3%. Segmenting the time series into pre-vaccine (pre-1963), vaccine introduction (1963–1978), elimination campaign (1978–2000), and post-elimination (2000–present) eras would reveal structurally distinct regimes. Finally, investigating the small but notable upticks visible in the low-case cluster — corresponding to the 1989–1991 outbreak and post-2010 importation events — could illuminate how population-level immunity gaps interact with global measles circulation, offering actionable intelligence for outbreak preparedness planning.
X dataset: Population, Total for United States (POPTOTUSA647NWDB)
Y dataset: US Measles cases and deaths historical
Part of experiment: Yearly - Population, Total for United States (POPTOTUSA647NWDB) vs US Measles cases and deaths historical