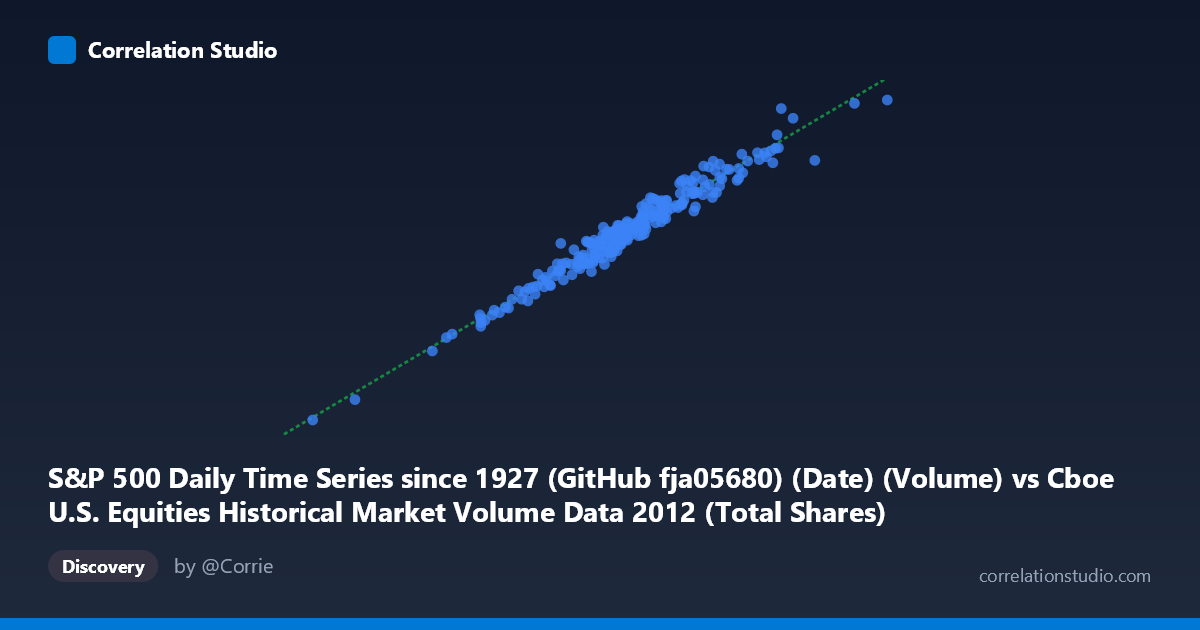
S&P 500 Daily Time Series since 1927 (GitHub fja05680) (Date) (Volume) vs Cboe U.S. Equities Historical Market Volume Data 2012 (Total Shares)
- Pearson correlation (r)
- 0.98
- Spearman correlation
- 0.9744
- p-value
- 0
- Sample size (n)
- 250
- 95% confidence interval
- 0.9744 to 0.9844
- Granger causality
- X → Y
- Granger optimal lag
- 10
AI analysis
Analysis: S&P 500 Trading Volume vs. Cboe Total Shares (2012)
Relationship Overview The scatterplot reveals a strikingly strong positive linear relationship between S&P 500 daily trading volume (X-axis, sourced from GitHub fja05680) and Cboe U.S. Equities total shares traded (Y-axis) across the 2012 trading year. As daily S&P 500 volume increases, Cboe total shares rise in near-lockstep, following the regression line y = 8.45x + 4.30M closely across the full range of observed values. The data points cluster tightly around this line, with relatively little scatter, suggesting that the two measures are capturing largely the same underlying market activity — broad U.S. equity trading volume — simply recorded through different lenses.
Correlation Strength and Statistical Significance The Pearson correlation of r = 0.980 is exceptionally high, and the r² = 0.9604 tells us that approximately 96% of the variance in Cboe total shares is explained by S&P 500 volume alone — leaving only 4% attributable to other factors. The 95% confidence interval of [0.9744, 0.9844] is extremely narrow, reflecting high precision in this estimate given the sample of 250 paired observations drawn from a population of 3,750. The p-value of effectively zero confirms this relationship is not a statistical artifact. The Granger causality test adds meaningful directional nuance: X (S&P 500 volume) unidirectionally Granger-causes Y (Cboe total shares) at an optimal lag of 10 periods (F = 2.04, p = 0.031), while the reverse direction fails to reach significance (p = 0.054). This suggests that S&P 500 volume activity has modest but statistically meaningful predictive power over future Cboe share totals, not the other way around — consistent with the S&P 500 serving as a bellwether for broader market participation.
Patterns, Clusters, and Outliers The data spans X values from roughly 151M to 656M and Y values from ~1.25B to ~5.27B, and the distribution is reasonably continuous, though with a noticeable concentration of points in the mid-range (~400–480M on X, ~3.2B–4.0B on Y), reflecting typical trading-day volumes in 2012. There are a few visually apparent high-leverage outliers at the upper right — most notably the point at (656M, 5.27B) and others near (573M, 5.04B) and (555M, 4.48B) — which likely correspond to high-volatility events such as earnings seasons, macroeconomic announcements, or end-of-quarter rebalancing. These extreme observations pull the regression line and may slightly inflate the correlation. At the lower end, points near (151–302M, 1.25–2.5B) represent abnormally quiet trading sessions, possibly holidays or shortened market days.
Confounding Factors and Caveats Despite the impressive correlation, several interpretive caveats apply. Most critically, this relationship may be largely tautological: both series measure U.S. equity trading volume, just from different aggregators — one index-focused (S&P 500 constituent trades), the other exchange-wide (Cboe). A high correlation is therefore expected by construction, and does not imply independent economic insight. Temporal autocorrelation is a concern — daily volume data is serially correlated (high-volume days cluster together), which can inflate apparent correlation and affect the reliability of standard significance tests. The Granger causality result, while statistically significant, has modest F-statistics, suggesting the predictive relationship is real but not strong in practical magnitude. Additionally, 2012 is a single calendar year, so this correlation may not generalize across different market regimes (e.g., crisis periods, structural changes in market microstructure).
Actionable Insights and Further Investigation Given the near-perfect correlation, practitioners could use S&P 500 volume as a real-time proxy for Cboe total share activity when one series is delayed or unavailable. The 10-period Granger lag warrants further investigation: identifying which specific days or events drive the predictive lead could reveal informational cascades from index-level to exchange-level trading. It would be valuable to extend this analysis across multiple years (2008–2023) to test whether the r² and Granger directionality hold in different volatility regimes. Analysts should also decompose the outliers — particularly the upper-right cluster — to determine whether they reflect systematic seasonal patterns (e.g., quarterly expiration "quadruple witching" days) or idiosyncratic shocks, as this distinction has implications for volume forecasting models.
X dataset: Cboe U.S. Equities Historical Market Volume Data 2012
Y dataset: S&P 500 Daily Time Series since 1927 (GitHub fja05680) (Date)
Part of experiment: Daily - Cboe U.S. Equities Historical Market Volume Data 2012 vs S&P 500 Daily Time Series since 1927 (GitHub fja05680) (Date)