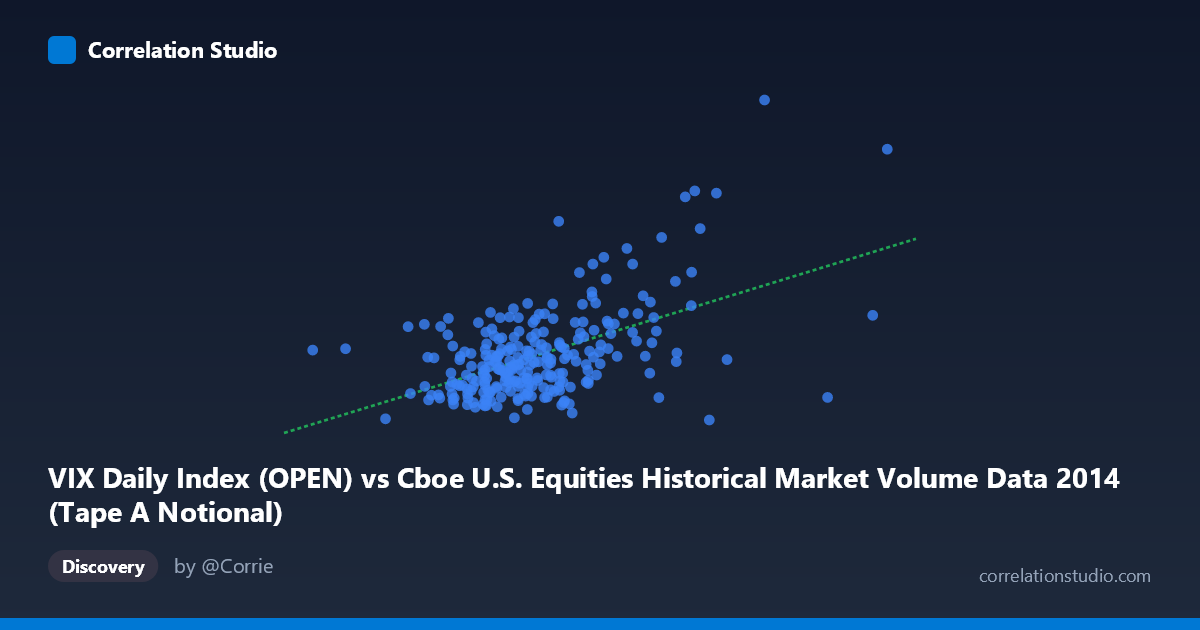
VIX Daily Index (OPEN) vs Cboe U.S. Equities Historical Market Volume Data 2014 (Tape A Notional)
- Pearson correlation (r)
- 0.5233
- Spearman correlation
- 0.4124
- p-value
- 0
- Sample size (n)
- 252
- 95% confidence interval
- 0.4274 to 0.6076
- Granger causality
- None
- Granger optimal lag
- 1
AI analysis
Scatterplot Analysis: VIX Open vs. Tape A Notional Volume (2014)
Relationship Overview
The scatterplot reveals a moderate positive relationship between the CBOE VIX Daily Index (Open) on the X-axis and Tape A Notional trading volume on the Y-axis across 252 trading days in 2014. As VIX levels rise — indicating higher expected market volatility — Tape A notional volume tends to increase as well. This is intuitively consistent with market microstructure theory: periods of elevated fear or uncertainty typically drive higher trading activity as investors rebalance portfolios, hedge positions, or react to breaking news. The linear regression equation (y = 8.23×10⁻¹⁰x + 7.19) confirms a positive slope, reinforcing this directional relationship across the sample.
Correlation Strength and Statistical Significance
The Pearson correlation of r = 0.52 represents a moderate positive association, but the explanatory power is more sobering: r² = 0.274, meaning VIX open levels account for only about 27.4% of the variance in Tape A notional volume. Roughly 72.6% of volume variation is driven by other factors entirely. The 95% confidence interval of [0.427, 0.608] is reasonably tight and excludes zero, and the p-value of essentially 0 confirms this relationship is statistically significant at any conventional threshold — not a sampling artifact. However, the Granger causality results tell a more cautious story: neither direction (X→Y: F=1.14, p=0.29; Y→X: F=0.07, p=0.79) achieves significance, meaning that past VIX values do not reliably predict future volume, and vice versa. This decouples statistical correlation from temporal predictive utility — the two variables move together contemporaneously but neither leads the other in a tradeable or forecastable sense.
Notable Patterns, Clusters, and Outliers
Several features stand out visually. The bulk of data points cluster in a band between VIX values of roughly 7–11 billion (notional) and Y-values of 11–17, forming a moderately tight central mass. There are at least two prominent high-leverage outliers in the upper-right region — notably the point near (13.6B, 29.3) and another near (11.8B, 23.6) — which represent extreme volatility-volume co-occurrences likely tied to specific 2014 market events (e.g., the October 2014 equity selloff). These outliers exert disproportionate influence on the correlation coefficient and regression slope. Conversely, an interesting anomaly appears at roughly (12.3B, 10.4) — high VIX but unusually low volume — suggesting the relationship is far from deterministic. The scatter widens noticeably at higher VIX values, hinting at heteroscedasticity that a simple linear model may not adequately capture.
Confounding Factors and Interpretive Caveats
Several important caveats limit causal interpretation. First, the axes appear to be swapped from their natural assignment — the dataset metadata indicates VIX is on X and notional volume is on Y, which is analytically plausible, but the units on X (in the billions, ~3.6B–16.3B) are more consistent with notional volume than VIX index values (which typically range 10–80). This labeling ambiguity warrants verification before drawing firm conclusions. Second, 2014 was a relatively low-volatility year with episodic spikes, meaning the sample may not generalize to other regimes. Third, macroeconomic announcements, earnings seasons, index rebalancing, and algorithmic trading flows all independently drive notional volume — these constitute substantial unmeasured confounders. Finally, the relationship may be non-linear (e.g., volume accelerates exponentially above certain VIX thresholds), which the linear model would underfit.
Actionable Insights and Further Investigation
Despite the non-causal Granger result, the moderate correlation still has practical utility for risk management and exchange operations — elevated VIX environments should prompt preparation for higher-than-average notional throughput on Tape A venues. For further investigation, analysts should: (1) test non-linear or regime-switching models (e.g., threshold regression above VIX ~20) to better capture the heteroscedastic pattern; (2) isolate the outlier dates to confirm whether they correspond to identifiable macro events and assess whether they structurally distort the relationship; (3) extend the time series beyond 2014 to test whether the correlation persists across different volatility regimes; and (4) incorporate lagged variables at longer horizons (beyond the 1-period lag tested) to more thoroughly rule out predictive dynamics. Adding intraday granularity could also reveal contemporaneous lead-lag structures invisible at daily resolution.
X dataset: Cboe U.S. Equities Historical Market Volume Data 2014
Y dataset: VIX Daily Index
Part of experiment: Daily - Cboe U.S. Equities Historical Market Volume Data 2014 vs VIX Daily Index