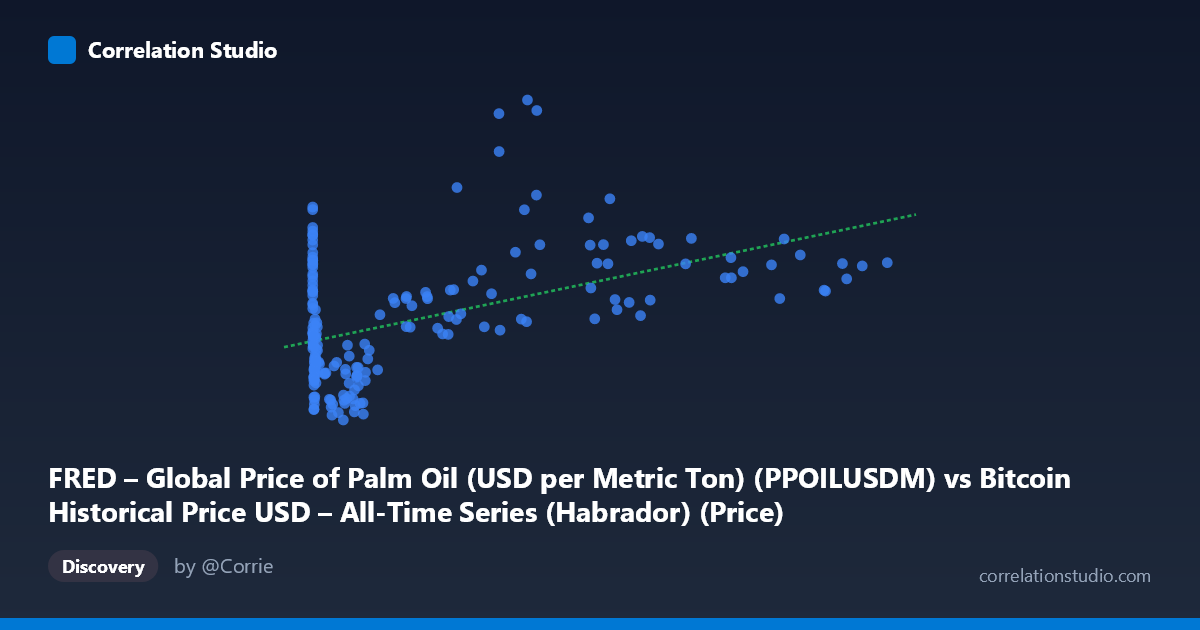
FRED – Global Price of Palm Oil (USD per Metric Ton) (PPOILUSDM) vs Bitcoin Historical Price USD – All-Time Series (Habrador) (Price)
- Pearson correlation (r)
- 0.4697
- Spearman correlation
- 0.2198
- p-value
- 0
- Sample size (n)
- 188
- 95% confidence interval
- 0.3501 to 0.5742
- Granger causality
- None
- Granger optimal lag
- 10
AI analysis
Analysis: Bitcoin Price vs. Palm Oil Price
1. Overview of the Relationship
The scatterplot displays a highly right-skewed relationship, driven primarily by the extreme scale disparity in the X variable (Bitcoin price, ranging from $0.06 to $118,670). The vast majority of data points cluster near the origin (X < 5,000), representing Bitcoin's early history (2010-2013), while a sparse tail of high-value points extends to the right, representing more recent bull-market prices. Palm oil (Y) shows a comparatively narrow range (~$444-$1,653/ton) throughout. Visually, the data suggests a weak upward drift in palm oil prices as Bitcoin prices climb into the tens of thousands, but the relationship is far from a clean linear trend — it's more of a loose, noisy tendency with substantial scatter at every X level.
2. Strength, Direction, and Statistical Confidence
The correlation coefficient (r = 0.470) indicates a moderate positive relationship, but r² = 0.221 reveals that only about 22% of the variance in palm oil prices is explained by Bitcoin's price — meaning nearly 78% of palm oil's price movement is driven by other factors entirely. The 95% CI [0.350, 0.574] is reasonably tight and excludes zero, and the p-value (1.05E-11) confirms this correlation is statistically significant and not due to chance, even though the underlying n (188) is smaller than the full population (411). However, statistical significance here reflects sample size and consistency of a modest association, not practical strength — this is not a relationship robust enough for reliable prediction. Critically, the Granger causality tests show no significant predictive direction in either direction (X→Y: p=0.380; Y→X: p=0.071, only marginal), meaning neither series reliably "leads" the other in time. This strongly suggests the correlation is likely coincidental co-movement (e.g., both trending upward over the same calendar period) rather than a genuine causal or lead-lag economic relationship.
3. Patterns, Clusters, and Outliers
The data shows a dense cluster of points at very low X values (Bitcoin under $1,000) with Y values scattered between roughly $480-$1,160 — this cluster alone shows little to no internal correlation, just noise. A secondary, sparser cluster appears at high X values (Bitcoin $40,000-$120,000) where palm oil prices trend somewhat higher (~$800-$1,650), pulling the regression line upward. Notably, one point (44,354.64, 1652.72) is a clear outlier — the highest palm oil price in the dataset, likely corresponding to the 2021-2022 global commodity price spike (COVID supply shocks, Ukraine war, biofuel demand) rather than any Bitcoin-driven effect. The regression line (slope ≈ 0.0037) is heavily influenced by this handful of high-X points; without them, the near-zero-X cluster alone would show essentially flat correlation.
4. Confounding Factors and Caveats
The most important caveat: this is a time-series correlation between two unrelated markets, and the shared upward trend over 2010-2026 is a classic confound. Bitcoin's price grew exponentially due to adoption/speculation cycles, while palm oil prices rose due to independent agricultural, biofuel-mandate, and global inflation dynamics (particularly 2020-2022 supply shocks). Both series may simply reflect broader macroeconomic trends (e.g., global liquidity, inflation, USD strength) rather than any direct interaction. Additionally, pairing monthly palm oil data with what appears to be higher-frequency Bitcoin price data (n=188 paired vs. N=411 population) means significant temporal aggregation/matching choices could distort the true relationship. The heavy right-skew in X also means the regression is disproportionately influenced by a small number of extreme Bitcoin price points.
5. Recommendations for Further Investigation
Given the lack of Granger causality, this correlation should not be used for predictive or trading purposes. To clarify whether this is spurious co-trending, analysts should: (a) detrend both series (e.g., using log returns instead of price levels) and re-test correlation on stationary data; (b) control for a common macro factor like the US Dollar Index, CPI, or global money supply (M2), which plausibly drives both series; (c) apply a log transformation to Bitcoin's price (given its exponential growth and scale range) before regression, since linear regression on raw values is likely misspecified; and (d) examine sub-period correlations (e.g., 2020-2022 vs. earlier years) to check if the relationship is driven entirely by the pandemic-era commodity/asset boom rather than a persistent structural link.
X dataset: Bitcoin Historical Price USD – All-Time Series (Habrador)
Y dataset: FRED – Global Price of Palm Oil (USD per Metric Ton)
Part of experiment: Bitcoin - Bitcoin Historical Price USD – All-Time Series (Habrador) vs FRED – Global Price of Palm Oil (USD per Metric Ton)