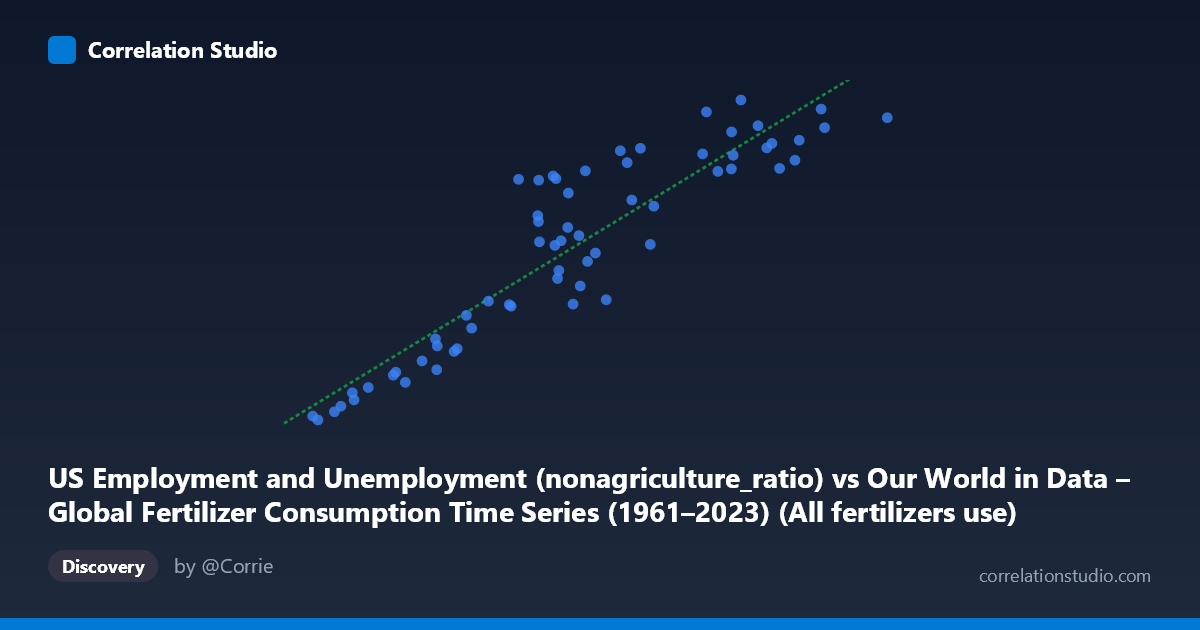
US Employment and Unemployment (nonagriculture_ratio) vs Our World in Data – Global Fertilizer Consumption Time Series (1961–2023) (All fertilizers use)
- Pearson correlation (r)
- 0.912
- Spearman correlation
- 0.9114
- p-value
- 0
- Sample size (n)
- 63
- 95% confidence interval
- 0.8581 to 0.946
- Granger causality
- X → Y
- Granger optimal lag
- 10
- Time coverage
- 1961-01-01 to 2023-01-01
AI analysis
Scatterplot Analysis: US Non-Agricultural Employment Ratio vs. Global Fertilizer Consumption
Relationship Overview
The scatterplot reveals a strong, positive relationship between the US non-agricultural employment ratio (X) and global all-fertilizer use (Y), with data spanning 1961 to 2023. As the non-agricultural employment ratio increases, global fertilizer consumption rises in a broadly consistent, upward-trending pattern. The linear regression equation (y = 0.00548x + 47,572) fits the data reasonably well across most of the range, though the scatter widens noticeably at higher X values, suggesting some heteroscedasticity or structural shifts in the relationship over time. Both variables exhibit substantial ranges — X spanning roughly 3.2M to 22.7M and Y ranging from ~60,500 to ~158,800 — indicating that this relationship is being observed across decades of meaningful economic and agricultural change.
Correlation Strength and Statistical Interpretation
The correlation is strong and statistically unambiguous: r = 0.912, with r² = 0.832, meaning that approximately 83.2% of the variance in global fertilizer consumption is explained by variation in the US non-agricultural employment ratio. The 95% confidence interval for r is [0.858, 0.946], which is both narrow and entirely positive, indicating high estimation precision with no plausible null result. The p-value of effectively zero confirms this association is not attributable to chance, even after accounting for the paired sample size of n = 63. The Granger causality analysis adds an important temporal dimension: X Granger-causes Y at a 10-period lag (F = 2.154, p = 0.049), while the reverse direction fails to reach significance (Y→X: p = 0.079). This suggests that changes in US employment structure have modest but detectable predictive power over future fertilizer consumption — though the marginal p-value warrants caution before treating this as a robust causal mechanism.
Notable Patterns, Clusters, and Outliers
Three visible clusters emerge in the scatterplot. A lower-left cluster (X: 3–8M, Y: 60,000–90,000) corresponds to earlier decades (roughly 1960s–1970s), where both employment and fertilizer use were lower. A middle cluster (X: 9–14M, Y: 90,000–135,000) represents transitional decades with considerable scatter, likely reflecting divergent global agricultural trends independent of US employment. An upper-right cluster (X: 15–22M, Y: 136,000–159,000) captures more recent decades where both variables have grown. Several points in the middle range deviate notably from the regression line — for instance, points near X ≈ 10–12M show Y values ranging widely from ~95,000 to ~135,000 — indicating that the relationship is not uniformly tight and that unexplained variance is concentrated in this mid-range zone.
Confounding Factors and Interpretive Caveats
The most significant caveat here is that both variables are primarily driven by time — they are secular trends growing over six decades, and their correlation likely reflects shared temporal momentum rather than any direct mechanistic link between US labor markets and global fertilizer demand. This is a textbook case of spurious correlation mediated by a common underlying driver (long-run economic and population growth). The Granger causality result, while suggestive, involves a 10-period lag which may be capturing delayed economic cycles rather than a genuine agricultural mechanism. Additionally, global fertilizer consumption is shaped by factors entirely exogenous to US employment: green revolution policy diffusion, Chinese agricultural expansion, commodity price cycles, and environmental regulations. The non-agricultural employment ratio also reflects structural economic shifts (manufacturing to services) that have no obvious agronomic pathway to fertilizer use.
Actionable Insights and Further Investigation
Given the high likelihood of spurious correlation, the most productive next step would be to partial out the time trend from both series and re-examine the residual correlation — if it collapses toward zero, the relationship is almost entirely time-driven. Researchers should also consider multivariate models incorporating global GDP, population, and cereal production as covariates to test whether US employment retains any independent explanatory power. The Granger causality result deserves replication with a longer lag sweep and robust standard errors to assess stability. Sector-level decomposition of US employment (e.g., agricultural-adjacent industries, chemical manufacturing) might reveal whether any sub-component has a theoretically defensible link to fertilizer demand. Finally, structural break testing around events like the 1973 oil shock, 1990s trade liberalization, and China's WTO accession would help determine whether the relationship is stable or an artifact of a particular historical regime.
X dataset: Our World in Data – Global Fertilizer Consumption Time Series (1961–2023)
Y dataset: US Employment and Unemployment
Part of experiment: Yearly - Our World in Data – Global Fertilizer Consumption Time Series (1961–2023) vs US Employment and Unemployment