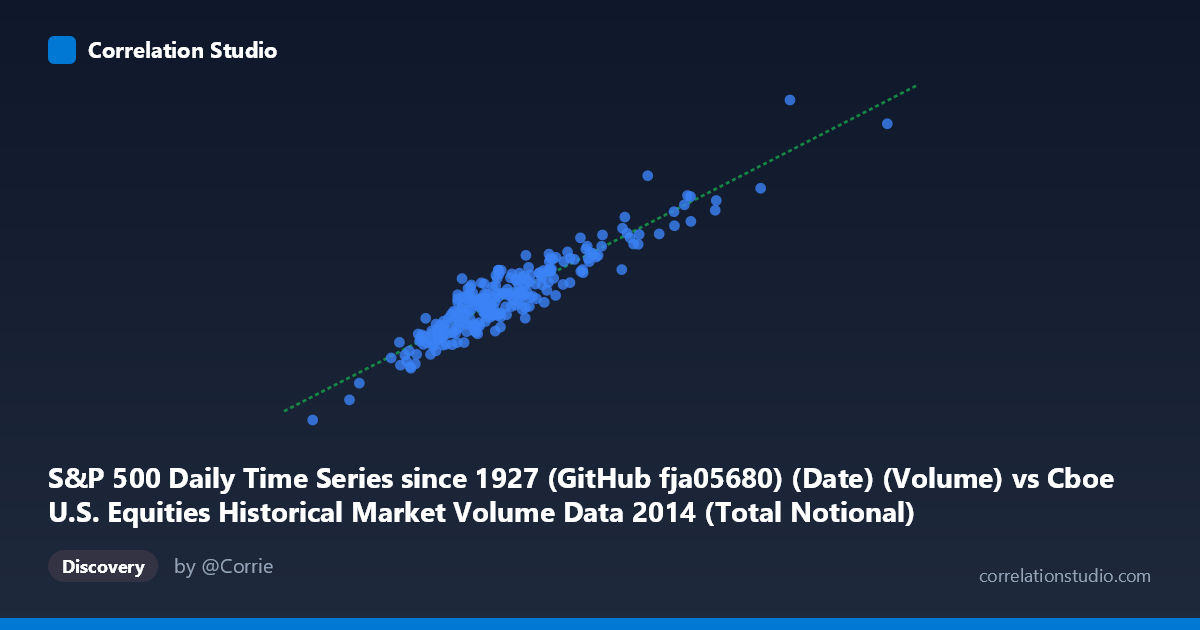
S&P 500 Daily Time Series since 1927 (GitHub fja05680) (Date) (Volume) vs Cboe U.S. Equities Historical Market Volume Data 2014 (Total Notional)
- Pearson correlation (r)
- 0.9344
- Spearman correlation
- 0.8921
- p-value
- 0
- Sample size (n)
- 252
- 95% confidence interval
- 0.9166 to 0.9484
- Granger causality
- None
- Granger optimal lag
- 10
AI analysis
Correlation Analysis: S&P 500 Trading Volume vs. Cboe Total Notional Value (2014)
Relationship Overview
The scatterplot reveals a strong, positive linear relationship between S&P 500 daily trading volume and Cboe U.S. Equities total notional value across 252 trading days in 2014. As daily share volume increases, the total dollar notional value of trades rises proportionally, which is economically intuitive — more shares changing hands naturally translates to greater aggregate transaction value. The data points cluster reasonably tightly around the regression line (y = 0.155x + 5.97×10⁸), suggesting that volume is a reliable predictor of notional value within this timeframe, though with meaningful scatter at higher volume levels where dispersion widens noticeably.
Correlation Strength and Statistical Significance
The Pearson correlation of r = 0.9344 indicates a very strong positive association, and the R² of 0.8730 means that approximately 87.3% of the variance in total notional value is explained by trading volume — a remarkably high figure for financial market data. The 95% confidence interval [0.9166, 0.9484] is narrow and sits entirely in the high-correlation range, reflecting precise estimation from a well-powered sample of n = 252 paired observations drawn from a population of N = 3,686. The p-value of effectively zero confirms that this correlation is not a sampling artifact. However, the Granger causality analysis complicates the narrative: neither direction (X→Y nor Y→X) achieves statistical significance at the optimal 10-period lag (F = 0.926, p = 0.510 and F = 0.781, p = 0.647, respectively). This means that while the two variables move together contemporaneously, past values of volume do not predict future notional value, and vice versa — they are synchronized co-movements rather than one leading the other temporally.
Notable Patterns, Clusters, and Outliers
Several features stand out in the scatterplot. The bulk of observations cluster in the central range (X: ~14–22 billion, Y: ~2.6–4.2 billion), forming a dense linear core. A handful of high-volume outliers extend toward the upper right, including one point near X = 37.8 billion / Y = 6.5 billion and another at roughly X = 31.2 billion / Y = 5.1 billion — these likely correspond to specific high-volatility events (e.g., geopolitical shocks, Fed announcements, or index rebalancing days in 2014). At the lower left, one extreme point at approximately (7.69B, 1.42B) — the dataset minimum — may reflect a holiday-shortened or anomalously quiet session. The scatter also appears to widen at higher volume levels (heteroscedasticity), suggesting the linear model may understate uncertainty during high-activity periods.
Confounding Factors and Interpretive Caveats
Several important caveats apply. First, price level is a major hidden driver: notional value equals shares × price, so if S&P 500 prices drifted upward through 2014, notional value would rise independent of volume changes — this could inflate the observed correlation. Second, the two datasets originate from different sources (Yahoo Finance for S&P 500 volume; Cboe for market-wide notional), meaning they measure overlapping but not identical trading universes — Cboe's notional includes all U.S. equities and TRFs, while S&P 500 volume is an index subset. Third, the absence of Granger causality at a 10-period lag may mask effects at shorter intraday timescales not captured in daily aggregation. Finally, the single-year scope (2014 only) limits generalizability; this year was characterized by relatively low volatility and steady price appreciation, which may suppress the natural range of volume-notional dynamics.
Actionable Insights and Further Investigation
The strong contemporaneous correlation makes trading volume a practical real-time proxy for notional market activity, useful for risk monitoring or liquidity estimation when full notional data is delayed. However, the failed Granger test argues against using lagged volume signals for forecasting notional value in trading strategies. Further investigation should: (1) partial out the price effect by normalizing notional value by average daily price to isolate pure volume relationships; (2) extend the time series across multiple market regimes (2008–2009 crisis, 2020 volatility spike) to test whether this correlation holds under stress; (3) test shorter lags (1–3 days) in Granger analysis, as 10-period lags may be too long for daily financial data; and (4) segment by market condition (VIX quartiles, earnings seasons) to determine whether the volume-notional relationship strengthens or breaks down under specific regimes.
X dataset: Cboe U.S. Equities Historical Market Volume Data 2014
Y dataset: S&P 500 Daily Time Series since 1927 (GitHub fja05680) (Date)
Part of experiment: Daily - Cboe U.S. Equities Historical Market Volume Data 2014 vs S&P 500 Daily Time Series since 1927 (GitHub fja05680) (Date)