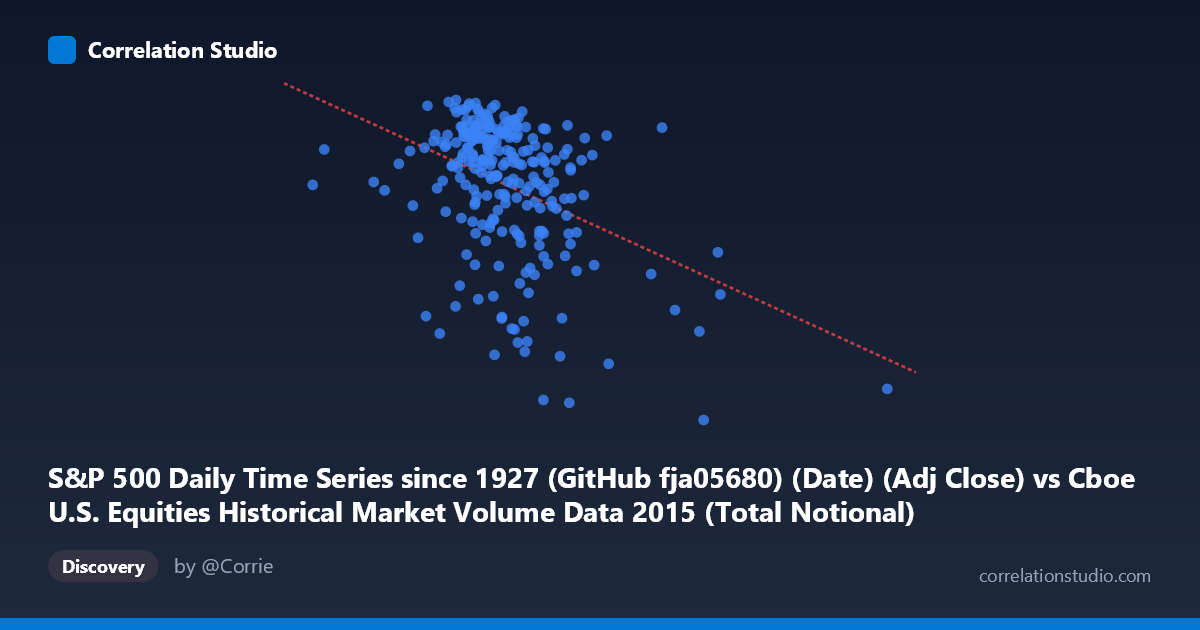
S&P 500 Daily Time Series since 1927 (GitHub fja05680) (Date) (Adj Close) vs Cboe U.S. Equities Historical Market Volume Data 2015 (Total Notional)
- Pearson correlation (r)
- -0.4018
- Spearman correlation
- -0.3441
- p-value
- 0
- Sample size (n)
- 252
- 95% confidence interval
- -0.5005 to -0.2928
- Granger causality
- None
- Granger optimal lag
- 2
AI analysis
Analysis: S&P 500 Adjusted Close vs. U.S. Equities Total Notional Volume (2015)
1. Overall Relationship The scatterplot reveals a negative relationship between U.S. equities total notional trading volume (X-axis) and the S&P 500 adjusted closing price (Y-axis) across 2015 trading days. The linear regression equation (y = −5.19×10⁻⁹x + 2171.22) confirms this inverse trend: as daily notional volume increases, S&P 500 prices tend to be lower. This is a counterintuitive but well-documented market phenomenon — elevated trading volume frequently accompanies stress, uncertainty, or selloffs rather than calm, steady appreciation. The relationship, while statistically significant, is far from deterministic, as the scatter around the regression line is considerable.
2. Strength, Direction, and Statistical Significance The Pearson correlation of r = −0.40 indicates a moderate negative association. However, the r² of 0.161 means that only about 16% of the variance in S&P 500 price levels is explained by notional volume — leaving 84% attributable to other factors. The 95% confidence interval of [−0.50, −0.29] is entirely negative, confirming the direction is reliable, and the p-value of 3.4×10⁻¹¹ makes this relationship highly statistically significant given n = 252 observations. That said, statistical significance here is partly a function of sample size and should not be conflated with practical or economic significance. Critically, the Granger causality tests find no significant predictive direction in either direction (X→Y: p = 0.057, just above threshold; Y→X: p = 0.799), meaning that neither variable reliably forecasts the other at a 2-day lag. Volume is not a useful leading indicator of price, nor vice versa, under this framework.
3. Notable Patterns, Clusters, and Outliers Several features stand out visually. The bulk of observations cluster in a relatively tight band — notional volume between ~15–25 billion and S&P prices between ~2,050–2,130 — representing "normal" 2015 trading conditions. However, there is a distinct lower-right cluster of points with very high notional volumes (30–49 billion) paired with notably depressed prices (~1,867–1,990), which likely corresponds to the August 2015 market correction, when panic selling drove both volumes and volatility sharply higher while prices dropped. One extreme outlier at approximately (48.9B, ~1,950) and another at (35.6B, 1,868) appear to anchor the regression line disproportionately. There is also a loose upper-left cluster of moderate-to-low volume days (~15–22B) associated with higher prices (~2,100–2,130), consistent with the low-volatility, gradually rising market conditions of early-to-mid 2015. The relationship appears partly non-linear — the inverse trend is driven largely by extreme volume events rather than a smooth monotonic relationship throughout.
4. Confounding Factors and Caveats The most important caveat is that this correlation is heavily influenced by a single market regime event — the August/September 2015 volatility episode — rather than reflecting a stable, persistent structural relationship. Removing those high-volume stress days would likely substantially weaken the correlation. Additionally, both variables share a common driver: market volatility (VIX). High-fear environments simultaneously depress prices and amplify trading volume, making volatility the true underlying variable of interest rather than a direct price-volume causal link. There is also a temporal autocorrelation concern: daily financial time series are not independent observations, which can inflate apparent statistical significance. The x-axis labels in the dataset metadata appear transposed (the "Date" column from an S&P 500 dataset is labeled as X, while "Total Notional" from the volume dataset appears as a descriptor), suggesting possible dataset join ambiguity that warrants verification before drawing firm conclusions.
5. Actionable Insights and Further Investigation The absence of Granger causality is arguably the most actionable finding: traders should not use notional volume as a simple leading indicator of next-day S&P 500 price direction. For further investigation, it would be valuable to: (1) segment the data by volatility regime (e.g., VIX above/below 20) to test whether the correlation is regime-dependent; (2) use log-transformed volume to reduce the leverage of extreme observations and assess whether the relationship is more log-linear; (3) include VIX as a control variable in a multivariate regression to see whether the price-volume correlation disappears once fear is accounted for; and (4) extend the time window beyond 2015 to test whether this negative correlation is a consistent annual feature or an artifact of one unusual year. The August 2015 outlier cluster especially warrants isolation as a separate analytical case study in stress-period market microstructure.
X dataset: Cboe U.S. Equities Historical Market Volume Data 2015
Y dataset: S&P 500 Daily Time Series since 1927 (GitHub fja05680) (Date)
Part of experiment: Daily - Cboe U.S. Equities Historical Market Volume Data 2015 vs S&P 500 Daily Time Series since 1927 (GitHub fja05680) (Date)