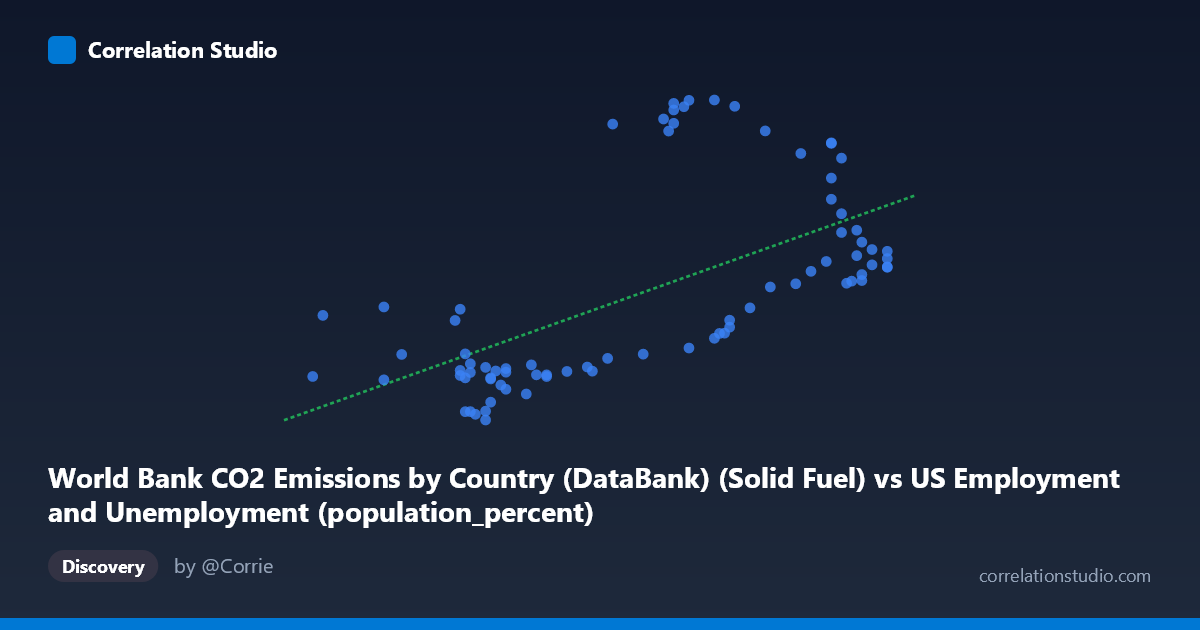
World Bank CO2 Emissions by Country (DataBank) (Solid Fuel) vs US Employment and Unemployment (population_percent)
- Pearson correlation (r)
- 0.6081
- Spearman correlation
- 0.6664
- p-value
- 0
- Sample size (n)
- 80
- 95% confidence interval
- 0.4483 to 0.7302
- Granger causality
- Y → X
- Granger optimal lag
- 10
AI analysis
Scatterplot Analysis: Solid Fuel CO2 Emissions vs. US Employment Population Percent
1. Overall Relationship Revealed
The scatterplot displays the relationship between US solid fuel CO2 emissions (X-axis) and US employment as a percentage of population (Y-axis) spanning 1941–2020. The visualization reveals a moderate positive association: as solid fuel CO2 emissions increase, employment population percentage tends to rise as well. However, the relationship is far from clean — the scatter is notably wide, and a striking bimodal or clustered vertical pattern is immediately apparent, with two distinct bands of Y values appearing at similar X values. This suggests the linear model captures only part of a more complex structural story, and a single regression line may be inadequate to describe the full data-generating process.
2. Correlation Strength, Direction, and Statistical Framing
The Pearson correlation of r = 0.608 indicates a moderate positive relationship, but the coefficient of determination r² = 0.370 is the more sobering statistic: only 37% of the variance in employment rates is explained by solid fuel emissions, leaving 63% attributable to other factors. The 95% confidence interval for r spans [0.448, 0.730], which is meaningfully wide — consistent with moderate but genuinely uncertain predictive power. The p-value of 2.2 × 10⁻⁹ confirms the correlation is highly statistically significant and almost certainly not a sampling artifact given n = 80. The linear regression equation (y = 1222.09x − 57,961.3) implies each unit increase in solid fuel emissions is associated with roughly 1,222 additional employment-population percentage points, though this scaling warrants careful dimensional scrutiny. Crucially, Granger causality runs unidirectionally from Y→X (F = 2.39, p = 0.021), meaning past employment rates have statistically significant predictive power over future solid fuel emissions — but not the reverse (X→Y: F = 1.30, p = 0.259). This is a critical framing reversal: rather than emissions driving employment, it appears that employment levels temporally precede and predict emissions, at a 10-period (decade) lag. This is economically intuitive — higher workforce participation drives industrial activity, which subsequently increases fossil fuel combustion.
3. Notable Patterns, Clusters, and Outliers
The most striking visual feature is the two dense horizontal clusters of Y values at roughly 10,000–16,000 and 28,000–31,000, both occurring across a relatively narrow X range (~58–67). This bimodal Y distribution suggests the data may reflect two distinct economic regimes — likely pre- and post- some structural break (possibly the post-WWII industrial expansion, the 1970s energy crises, or the post-2000 deindustrialization era). Several points in the upper cluster (e.g., ~62.9, 29,871; ~63.2, 31,131; ~64.1, 30,729) appear as high-leverage observations pulling the regression line upward disproportionately. Conversely, points like (56.0, 16,616) and (57.2, 17,184) are potential outliers on the lower-X end with surprisingly high Y values, inconsistent with the general trend at that emissions level. The lower-left cluster (X ~58–61, Y ~10,000–14,000) is tightly packed, suggesting a period of relatively stable, low-emissions and lower employment activity.
4. Confounding Factors and Interpretive Caveats
Several important caveats temper interpretation. First, this is an ecological/aggregate correlation — associating national-level emissions with a population percentage metric — so individual-level causal inference is inappropriate. Second, long-run time-series data spanning 80 years is highly susceptible to spurious correlation from shared secular trends: both variables could simply be rising (or falling) together due to GDP growth, population expansion, or technological change rather than any direct mechanism. Third, the dataset label mismatch is concerning: X is labeled as coming from a "US Employment and Unemployment" dataset yet measures CO2 emissions, while Y is from a "World Bank CO2 Emissions" dataset yet measures employment percentage — suggesting possible dataset join or column assignment errors that must be verified before any policy conclusions are drawn. Fourth, the 10-period Granger lag is extremely long and may reflect spurious autocorrelation structure rather than genuine predictive causality. Finally, the transition away from solid fuels after ~2005 and changes in BLS employment definitions over decades represent structural non-stationarities that violate standard regression assumptions.
5. Actionable Insights and Further Investigation
Given the Granger result, a productive next step would be to formally test for structural breaks (e.g., Chow test, CUSUM) around known economic inflection points (1973 oil shock, 1980s recession, 2008 financial crisis) to determine whether the apparent bimodal clustering reflects regime changes. Researchers should verify the dataset column assignments to rule out a labeling inversion before proceeding with any causal claims. It would also be valuable to decompose both time series (HP filter or first-differencing) to remove shared trends and re-estimate the correlation on stationary residuals — this would reveal whether the r = 0.608 survives detrending or collapses, distinguishing genuine co-movement from spurious trend correlation. Finally, incorporating additional mediating variables (GDP per capita, energy price indices, manufacturing employment share) into a multivariate model would help isolate whether the employment→emissions Granger pathway is robust or proxying for industrial output more broadly.
X dataset: US Employment and Unemployment
Y dataset: World Bank CO2 Emissions by Country (DataBank)
Part of experiment: Yearly - US Employment and Unemployment vs World Bank CO2 Emissions by Country (DataBank)