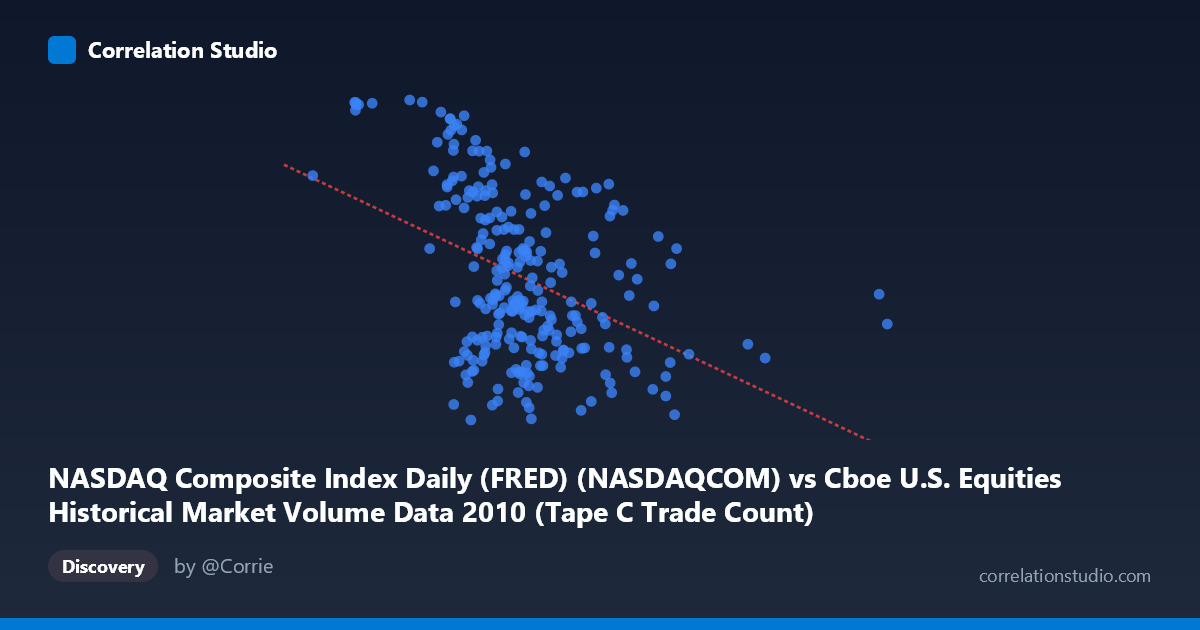
NASDAQ Composite Index Daily (FRED) (NASDAQCOM) vs Cboe U.S. Equities Historical Market Volume Data 2010 (Tape C Trade Count)
- Pearson correlation (r)
- -0.4173
- Spearman correlation
- -0.4057
- p-value
- 0
- Sample size (n)
- 252
- 95% confidence interval
- -0.5143 to -0.3097
- Granger causality
- None
- Granger optimal lag
- 9
- Time coverage
- 2010-01-04 to 2010-12-31
- Recomputed on refreshed data
- 2026-10-23 (r was -0.4173)
AI analysis
Scatterplot Analysis: NASDAQ Composite Index vs. Cboe Tape C Trade Count (2010)
Overall Relationship
The scatterplot reveals a moderate negative relationship between the NASDAQ Composite Index level and Cboe Tape C Trade Count across 252 trading days in 2010. As the NASDAQ index rises, the number of trades on Tape C (typically NYSE Arca-listed securities) tends to decrease. The fitted regression line (y = −0.000407x + 2,600.28) captures this downward slope, but the considerable scatter around the line makes immediately clear that index level alone is a poor standalone predictor of trading activity. The relationship, while statistically real, is far from deterministic.
Correlation Strength and Statistical Significance
With r = −0.417 and r² = 0.174, the NASDAQ index level explains only about 17.4% of the variance in Tape C trade counts — meaning roughly 82.6% of the variation in trading activity is driven by factors entirely outside this model. The 95% confidence interval for r spans [−0.514, −0.310], confirming a consistently negative association but also revealing meaningful uncertainty in the precise magnitude. The p-value of 4.9×10⁻¹² is highly significant given a population of N = 3,302 and a paired sample of n = 252, so the negative correlation is unlikely to be a statistical artifact. However, Granger causality tests tell a critical story: neither direction achieves significance (X→Y: F = 0.976, p = 0.461; Y→X: F = 1.150, p = 0.329), meaning neither the NASDAQ level nor Tape C trade counts can meaningfully predict each other's future values at the optimal 9-period lag. The correlation is contemporaneous and associative, not predictive or causal.
Notable Patterns, Clusters, and Outliers
Several features stand out in the data. The bulk of observations cluster between NASDAQ values of roughly 450,000–850,000 and trade counts of 2,100–2,550, forming a moderately dense central cloud with substantial vertical spread — suggesting high day-to-day variability in trade counts even at similar index levels. A small number of right-side outliers are visible at very high NASDAQ values (notably one point near x = 1,379,287), which appear to exert leverage on the regression line. On the upper-left portion of the chart, several points with lower NASDAQ values exhibit notably high trade counts (approaching 2,650–2,671), consistent with the negative slope but forming a somewhat distinct high-volume cluster. The spread of Y values (~580 units across the full range) relative to the moderate X variation suggests heteroscedasticity may be present, with variance in trade counts potentially widening at lower index levels.
Confounding Factors and Interpretive Caveats
Several important caveats apply. First, 2010 was a distinctive market environment — recovering from the 2008–2009 financial crisis, featuring the May 2010 Flash Crash, and characterized by elevated algorithmic and high-frequency trading volumes that can decouple trade counts from price-level dynamics. Second, the negative correlation likely reflects a risk-appetite dynamic: when markets fall (lower NASDAQ), uncertainty spurs increased trading activity, while rising markets may reflect calmer, lower-volume drift — a well-documented market microstructure phenomenon. Third, Tape C captures only a subset of equity volume (NYSE Arca-listed securities), so compositional shifts in where trading occurs across venues could contaminate this relationship. Finally, temporal autocorrelation in both daily index levels and trade counts could inflate the effective sample size, making the p-value appear more precise than warranted.
Actionable Insights and Further Investigation
Given the weak explanatory power and absent Granger causality, practitioners should not use the NASDAQ index level alone as a trade-volume forecasting tool. More productive directions would include: (1) incorporating VIX or realized volatility as covariates, since volatility-driven trading is likely the true underlying mechanism; (2) examining whether the negative relationship holds intraday or at a weekly aggregation, which might clarify whether it reflects structural or transient dynamics; (3) testing whether the Flash Crash period (May 6, 2010) disproportionately drives the observed correlation and whether removing those anomalous days changes the relationship materially; and (4) expanding to a multi-venue model comparing Tape A, B, and C volumes simultaneously to understand market share shifts as a confound. The finding is statistically interesting but practically limited without richer modeling.
X dataset: Cboe U.S. Equities Historical Market Volume Data 2010
Y dataset: NASDAQ Composite Index Daily (FRED)
Part of experiment: Daily - Cboe U.S. Equities Historical Market Volume Data 2010 vs NASDAQ Composite Index Daily (FRED)