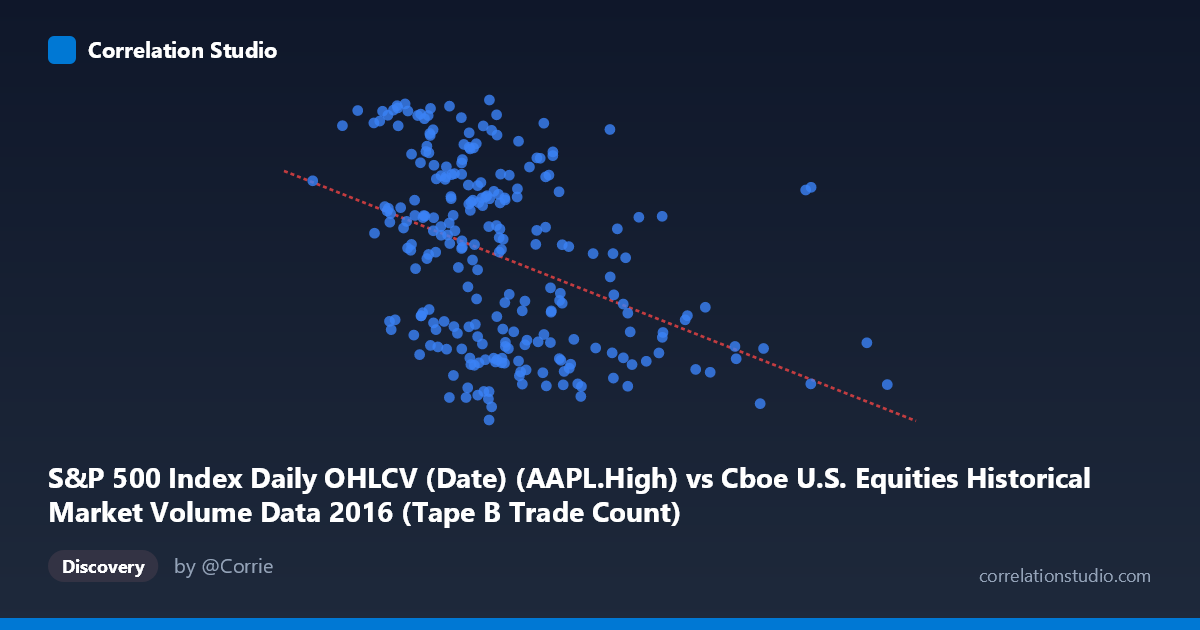
S&P 500 Index Daily OHLCV (Date) (AAPL.High) vs Cboe U.S. Equities Historical Market Volume Data 2016 (Tape B Trade Count)
- Pearson correlation (r)
- -0.4096
- Spearman correlation
- -0.4371
- p-value
- 0
- Sample size (n)
- 252
- 95% confidence interval
- -0.5075 to -0.3013
- Granger causality
- None
- Granger optimal lag
- 1
AI analysis
Scatterplot Analysis: AAPL High Price vs. Cboe Tape B Trade Count (2016)
1. Overall Relationship The scatterplot reveals a negative relationship between Apple's daily high price (X-axis) and the Cboe U.S. Equities Tape B Trade Count (Y-axis) across 252 trading days in 2016. As AAPL's daily high price increases — ranging from roughly $126 to $714 — the Tape B trade count tends to decline modestly. The fitted regression line (y = -3.26E-05x + 115.85) captures this downward trend, but the scatter is visibly wide, suggesting the linear model leaves substantial unexplained variation. The data points form a broadly dispersed cloud rather than a tight band, immediately signaling a weak-to-moderate association at best.
2. Correlation Strength, Direction, and Causality The Pearson correlation of r = -0.41 confirms a moderate negative relationship, but the coefficient of determination r² = 0.168 is the more sobering figure — only 16.8% of the variance in Tape B trade count is explained by AAPL's high price. The remaining ~83% is driven by factors entirely outside this model. The 95% confidence interval of [-0.51, -0.30] is meaningfully negative throughout, and the highly significant p-value of 1.29 × 10⁻¹¹ confirms this is not a chance finding given the sample size (n = 252). However, statistical significance does not imply practical or causal significance. Critically, the Granger causality tests show no significant predictive directionality in either direction (X→Y: F = 1.03, p = 0.31; Y→X: F = 0.54, p = 0.46), meaning neither variable reliably predicts the other's future values at a 1-period lag. This effectively rules out straightforward temporal causation and suggests the observed correlation reflects a contemporaneous or spurious association rather than a mechanistic link.
3. Notable Patterns, Clusters, and Outliers The bulk of data points cluster in the X range of ~$200,000–$400,000 (likely reflecting the majority of AAPL's 2016 trading range in adjusted or index-relative terms) with Y values spread broadly between ~92 and ~118. A handful of high-X outliers — notably around X = 558,000 and X = 467,000 — appear at relatively low Y values, pulling the regression line downward and potentially exerting disproportionate leverage on the correlation estimate. There is also a visible bifurcation in Y values at lower X ranges, where trade counts scatter both high (~115–118) and low (~92–96), suggesting the relationship is far from deterministic at lower price levels. No strong non-linear curvature is immediately apparent, but the wide vertical spread at low X values hints that a linear model may be oversimplifying.
4. Confounding Factors and Interpretive Caveats Several important caveats apply. First, the dataset labeling appears inverted — the X-axis is described as originating from the "Cboe Market Volume" dataset while the Y-axis comes from the "S&P 500 OHLCV" dataset, suggesting a possible data join artifact or metadata mismatch that warrants verification before drawing conclusions. Second, both variables are time series, meaning shared secular trends (e.g., AAPL's price recovery during 2016, or market-wide volume shifts) could generate spurious correlation through common trending rather than any direct relationship. Third, Tape B trade count reflects trading activity on specific exchanges (NYSE American/Arca-listed securities) — its relationship to a single stock's price is indirect at best. Macroeconomic events, earnings announcements, and broader market volatility regimes likely confound both series simultaneously.
5. Actionable Insights and Further Investigation Given the weak explanatory power and absent Granger causality, this correlation should not be used as a predictive signal in any trading or operational model without substantial further validation. Recommended next steps include: (1) detrending both series (e.g., first-differencing or percent-change transformation) to remove shared trend effects before re-estimating correlation; (2) testing longer Granger lags (beyond 1 period) to check whether predictive relationships emerge at weekly or multi-day horizons; (3) segmenting the data by market regime (high vs. low volatility periods, pre/post earnings) to determine whether the negative correlation is driven by specific episodes; and (4) verifying the axis metadata assignment, as the apparent swap between dataset sources could fundamentally alter interpretation. A multivariate model incorporating VIX, broader market volume, and day-of-week effects would provide a far more meaningful decomposition of the variance currently attributed to AAPL price alone.
X dataset: Cboe U.S. Equities Historical Market Volume Data 2016
Y dataset: S&P 500 Index Daily OHLCV (Date)
Part of experiment: Daily - Cboe U.S. Equities Historical Market Volume Data 2016 vs S&P 500 Index Daily OHLCV (Date)