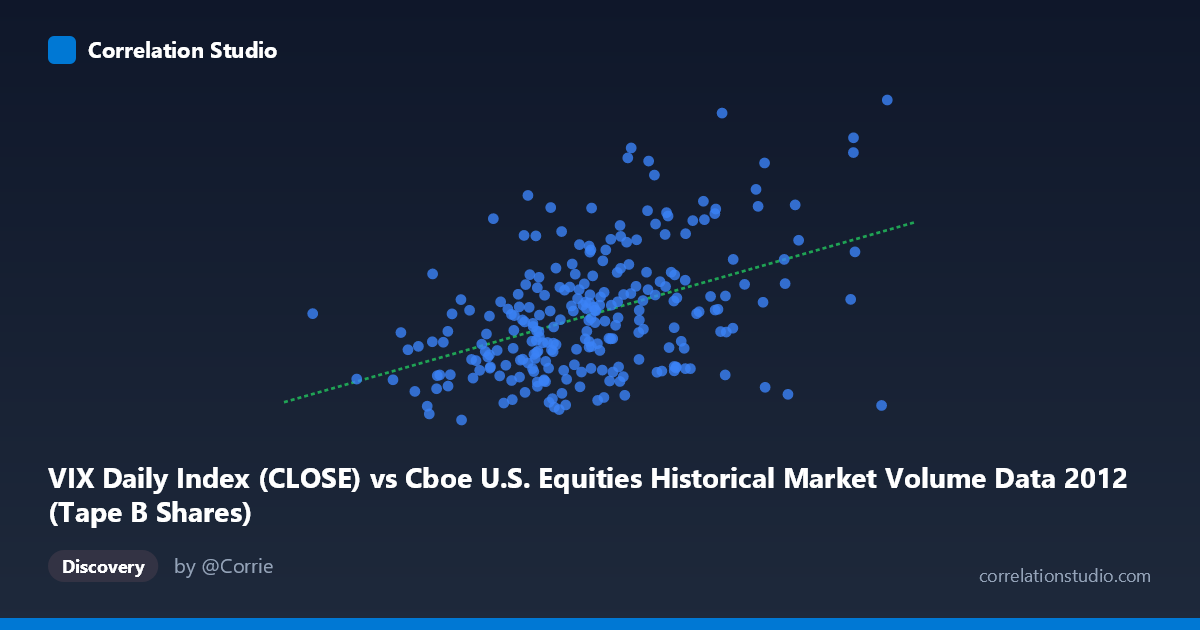
VIX Daily Index (CLOSE) vs Cboe U.S. Equities Historical Market Volume Data 2012 (Tape B Shares)
- Pearson correlation (r)
- 0.4476
- Spearman correlation
- 0.4153
- p-value
- 0
- Sample size (n)
- 250
- 95% confidence interval
- 0.3425 to 0.5416
- Granger causality
- None
- Granger optimal lag
- 1
AI analysis
Scatterplot Analysis: VIX vs. Tape B Shares (2012)
Relationship Overview The scatterplot reveals a moderate positive relationship between Cboe U.S. Equities daily market volume (VIX Daily Index CLOSE, on the X-axis) and Tape B Shares volume. As market volume increases, VIX-related Tape B Shares tend to rise as well, consistent with the intuition that higher trading activity often accompanies elevated volatility regimes. The linear regression equation (y = 7.56×10⁻⁸x + 12.49) captures this upward trend, though the scatter around the regression line is substantial, signaling that the relationship is far from deterministic.
Correlation Strength and Statistical Significance The Pearson correlation of r = 0.4476 indicates a moderate positive association, but the explanatory power is modest: R² = 0.2003, meaning only ~20% of the variance in Tape B Shares is explained by market volume. The remaining 80% is driven by other factors entirely. The 95% confidence interval of [0.3425, 0.5416] is reasonably narrow given n = 250, suggesting the estimate is stable, and the p-value of 1.017×10⁻¹³ confirms the correlation is highly statistically significant — virtually impossible to attribute to chance. However, statistical significance here is partly a function of the large underlying population (N = 3,750); practical significance remains limited given the low R².
Granger Causality and Temporal Direction Despite the meaningful contemporaneous correlation, the Granger causality results are unambiguous: neither direction achieves significance. X→Y yields F = 1.38, p = 0.24, and Y→X yields F = 0.24, p = 0.63 — both well above conventional thresholds. At the optimal lag of 1 period, neither variable meaningfully predicts the other's future values. This is a critical caveat: the correlation reflects co-movement within the same trading day, not a predictive or causal lead-lag relationship. Traders or analysts should not attempt to use lagged volume to forecast next-day VIX behavior (or vice versa) based on this data.
Notable Patterns, Clusters, and Outliers The sample points reveal several features worth noting. There is a dense central cluster around X ≈ 60–80 million (near the mean of ~70.2M) and Y ≈ 15–20, consistent with typical 2012 trading conditions. However, a handful of high-Y outliers (Tape B Shares values of 22–26+) at varying X values — including points near (80M, 23.6), (75.9M, 24.3), (63.9M, 22.2), and (79.1M, 24.1) — suggest episodic volatility spikes that are not tightly tied to volume levels. Conversely, some high-X, low-Y points (e.g., ~110M volume at only 18.4 Tape B Shares; ~100.8M at 14.5) indicate that very high volume days do not necessarily coincide with elevated VIX readings, hinting at possible non-linearity or regime-dependent behavior at the tails.
Caveats, Confounds, and Further Investigation Several confounding factors deserve attention. Day-of-week and month effects in 2012 (e.g., end-of-quarter rebalancing, the European debt crisis episodes) could create spurious co-movement between volume and volatility that is driven by a common third factor — macroeconomic news or institutional flows — rather than a direct link. The aggregation of all exchange venues into a single volume metric may obscure venue-specific dynamics. Additionally, 2012 was a relatively low-volatility year with a constrained VIX range (13–27), which may compress the correlation compared to more turbulent periods. For further investigation, it would be valuable to: (1) segment by volatility regime (e.g., VIX above/below 20) to test whether the relationship strengthens in stress periods; (2) introduce lagged macroeconomic controls such as S&P 500 returns or news sentiment; and (3) explore non-linear or quantile regression models to better capture the tail behavior visible in the outlier cluster.
X dataset: Cboe U.S. Equities Historical Market Volume Data 2012
Y dataset: VIX Daily Index
Part of experiment: Daily - Cboe U.S. Equities Historical Market Volume Data 2012 vs VIX Daily Index