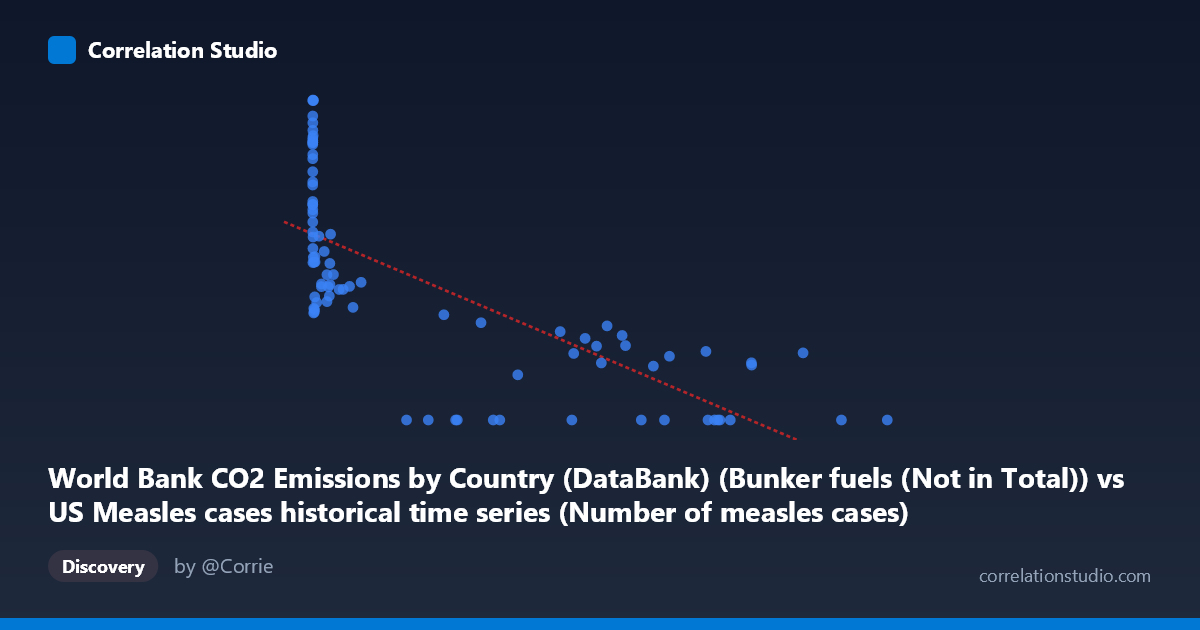
World Bank CO2 Emissions by Country (DataBank) (Bunker fuels (Not in Total)) vs US Measles cases historical time series (Number of measles cases)
- Pearson correlation (r)
- -0.7338
- Spearman correlation
- -0.8717
- p-value
- 0
- Sample size (n)
- 87
- 95% confidence interval
- -0.818 to -0.6188
- Granger causality
- None
- Granger optimal lag
- 10
AI analysis
Analysis: World Bank Bunker Fuel CO2 Emissions vs. US Measles Cases (1919–2020)
1. What the Visualization Reveals
The scatterplot displays a striking negative relationship between global bunker fuel CO2 emissions and US measles case counts across roughly a century of data. As bunker fuel emissions increase (moving right along the X-axis), measles cases tend to decrease dramatically — from values exceeding 1,500 cases at low emission levels to near zero at the highest emission values. The data points form a broadly descending arc rather than a tight linear band, with a dense cluster of high-Y/low-X points at the left side of the chart and a spread of low-Y/high-X points extending across the right. This visual shape immediately signals that both variables are primarily driven by the passage of time — one rising, one falling — rather than by any direct mechanistic relationship.
2. Correlation Strength, Direction, and Temporal Causality
The Pearson correlation of r = −0.7338 indicates a strong negative association, and the R² = 0.5385 tells us that approximately 53.8% of the variance in measles cases is statistically "explained" by bunker fuel emissions within this linear model. That is a numerically substantial figure, but it is almost entirely attributable to shared time trends rather than any causal pathway. The 95% confidence interval of [−0.8180, −0.6188] is relatively narrow and excludes zero convincingly, and the p-value of 6.661×10⁻¹⁶ confirms the association is statistically indistinguishable from noise by any conventional threshold. However, the Granger causality tests decisively undercut any causal inference: neither direction (X→Y: F = 0.9541, p = 0.493; Y→X: F = 0.8952, p = 0.544) approaches significance. This means that knowing past bunker fuel emissions adds no predictive power for future measles cases beyond what is already known from measles' own history, and vice versa. The correlation, however strong numerically, carries no temporal predictive signal.
3. Notable Patterns, Clusters, and Non-Linearity
Several structural features stand out. First, there is a dense left-side cluster of points with very low X values (<50,000 units) and highly variable Y values spanning the full range from ~530 to 1,590 — these likely correspond to the pre-WWII era when both measles was endemic and international shipping emissions were minimal. Second, there is a floor effect at Y = 0 for many high-X observations, reflecting the post-1963 vaccine era when measles was effectively eliminated in the US. Third, the Spearman ρ exceeds Pearson r, confirming the relationship is better described as monotonic but non-linear — a logarithmic or sigmoid curve would almost certainly fit better than the fitted linear equation (y = −0.00136x + 925.17), which would predict negative measles cases at the highest emission levels, an obvious impossibility. Specific outliers worth noting include the point near (1274, 1589.59) — an extreme high-Y, low-X value — and several zero-Y points scattered across a wide X range, suggesting the vaccine-era floor dominates the right half of the distribution.
4. Confounding Factors and Interpretive Caveats
This correlation is a textbook example of a spurious temporal coincidence. Both variables are almost entirely driven by a common third variable: calendar time. Measles declined due to the introduction of the measles vaccine in 1963, improved public health infrastructure, and mandatory vaccination programs. Bunker fuel emissions rose due to global industrialization, expanding maritime trade, and economic growth — entirely unrelated processes. Additional confounders include changes in reporting standards for measles cases over a century, geopolitical disruptions (WWII causing temporary dips in both shipping and reporting), and population growth affecting both denominators. The fact that bunker fuels are explicitly excluded from national totals in the World Bank dataset also raises the question of whether this is even the most meaningful emissions series, further weakening any substantive interpretation. The non-linearity further suggests that a single regression model obscures at least two distinct regimes: pre-vaccine (high measles, low emissions) and post-vaccine (near-zero measles, high emissions).
5. Actionable Insights and Further Investigation
Given that this is almost certainly a spurious correlation, the most productive next steps are methodological rather than substantive. Detrending both series (e.g., via first-differencing or removing the shared time trend) before computing correlation would reveal whether any residual association remains after accounting for shared temporal drift — the near-certain answer is no. Segmenting the analysis into pre-1963 and post-1963 periods would test whether the correlation holds within each regime independently. To understand measles dynamics properly, relevant covariates such as vaccination rates, population density, international travel volumes, and outbreak notification policies should replace the emissions variable entirely. If the goal is to study CO2 emissions correlates, measles cases are clearly not a meaningful partner variable. This analysis serves best as a pedagogical illustration of why high R² and low p-values do not imply causation, especially with long historical time series where nearly any rising trend will correlate with any falling trend.
X dataset: US Measles cases historical time series
Y dataset: World Bank CO2 Emissions by Country (DataBank)
Part of experiment: Yearly - US Measles cases historical time series vs World Bank CO2 Emissions by Country (DataBank)