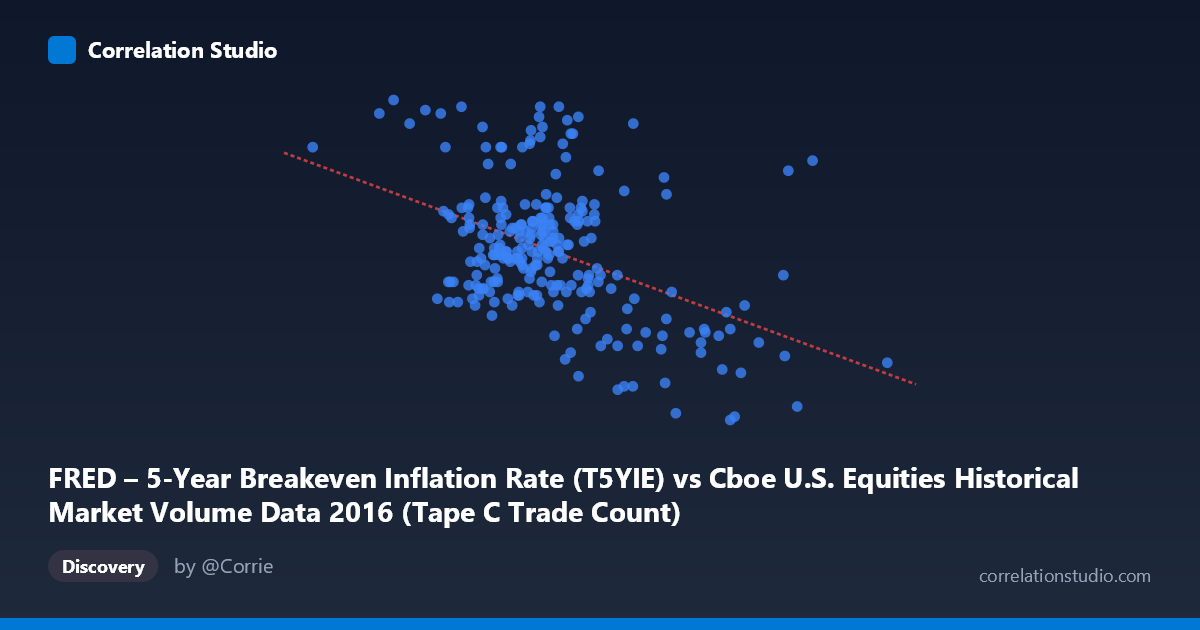
FRED – 5-Year Breakeven Inflation Rate (T5YIE) vs Cboe U.S. Equities Historical Market Volume Data 2016 (Tape C Trade Count)
- Pearson correlation (r)
- -0.4472
- Spearman correlation
- -0.3136
- p-value
- 0
- Sample size (n)
- 250
- 95% confidence interval
- -0.5412 to -0.3421
- Granger causality
- Y → X
- Granger optimal lag
- 1
AI analysis
Analysis: 5-Year Breakeven Inflation Rate vs. Cboe U.S. Equities Trade Count (2016)
Relationship Overview The scatterplot reveals a moderate negative relationship between Cboe U.S. equities market trade count (Tape C) and the 5-year breakeven inflation rate across 2016. As equity trading volume (measured by trade counts) increases, the 5-year forward inflation expectation tends to decrease, and vice versa. The linear regression equation (y = -5.98×10⁻⁷x + 1.858) quantifies this inverse slope, suggesting that each additional ~1.67 million trades corresponds to roughly a 1 basis point decline in the breakeven inflation rate. This is a counterintuitive but interpretable relationship — periods of elevated trading activity often coincide with market stress or risk-off episodes, which historically correlate with suppressed inflation expectations.
Correlation Strength and Statistical Significance The Pearson correlation of r = -0.447 indicates a moderate negative association, but the explanatory power is modest: r² = 0.20, meaning only 20% of the variance in the breakeven inflation rate is explained by trade count activity. The remaining 80% of variation stems from factors not captured in this bivariate model. The 95% confidence interval of [-0.541, -0.342] is entirely negative and reasonably tight, confirming directional consistency, while the p-value of 1.07×10⁻¹³ makes it statistically unambiguous that this relationship is not a sampling artifact across the n=250 paired observations drawn from N=3,622. Critically, Granger causality runs unidirectionally from Y→X (inflation expectations → trade count; F=5.01, p=0.026), with the reverse direction failing significance (F=2.07, p=0.152). This suggests that changes in inflation expectations temporally precede changes in equity trading volume at a 1-period lag — a meaningful finding implying that inflation sentiment may act as a leading signal for market activity levels.
Notable Patterns, Clusters, and Outliers Several structural features stand out in the data. The bulk of observations cluster in the 550,000–850,000 trade count range paired with inflation rates between 1.25 and 1.65, forming a dense central core. However, there are notable high-X outliers — particularly points near 1,143,268 and 1,187,414 trade counts — that appear at relatively elevated inflation rates (~1.67–1.70), partially contradicting the negative trend and likely representing anomalous high-volume trading days (e.g., index rebalancing, election-related volatility in November 2016). Conversely, an extreme low-Y outlier near (832,885, 1.02) represents a day of very high volume but unusually depressed inflation expectations. A point at (725,839, 1.86) represents the highest observed inflation reading with only moderate trade count, consistent with the negative trend. The scatter is notably heteroscedastic, with wider Y-dispersion at lower trade counts and tighter clustering at higher volumes.
Confounding Factors and Caveats Several important caveats temper causal interpretation. First, 2016 was an unusually eventful macroeconomic year — Brexit (June), the U.S. presidential election (November), and two Federal Reserve rate decisions all generated discrete regime shifts in both inflation expectations and trading volumes simultaneously, meaning shared responses to external shocks likely inflate the apparent correlation. Second, Tape C specifically captures NYSE Arca and related venues, not total market volume, so this is a partial measure of market activity. Third, the Granger causality result, while statistically significant, operates at a 1-day lag and explains predictive precedence rather than structural causation — the relationship could be mediated through risk appetite, bond market dynamics, or institutional positioning rather than a direct mechanism. Finally, daily breakeven rates embed liquidity premiums and TIPS-specific supply/demand effects that may be orthogonal to equity market activity.
Actionable Insights and Further Investigation Despite the 80% unexplained variance, the Granger result offers a practically useful signal: monitoring daily shifts in 5-year breakeven inflation rates may provide modest leading information about next-day equity trading volume levels. Market microstructure researchers and volatility traders could explore whether this relationship strengthens around FOMC announcement windows or CPI release dates. Further investigation should include: (1) extending the analysis beyond 2016 to test temporal stability of this relationship; (2) incorporating VIX or credit spreads as control variables to isolate whether the correlation survives adjustment for broad risk sentiment; (3) testing non-linear specifications (e.g., piecewise or quantile regression) given the visible heteroscedasticity; and (4) examining whether total consolidated tape volume (not just Tape C) produces a stronger or weaker signal, to assess whether the finding is venue-specific or market-wide.
X dataset: Cboe U.S. Equities Historical Market Volume Data 2016
Y dataset: FRED – 5-Year Breakeven Inflation Rate
Part of experiment: Daily - Cboe U.S. Equities Historical Market Volume Data 2016 vs FRED – 5-Year Breakeven Inflation Rate