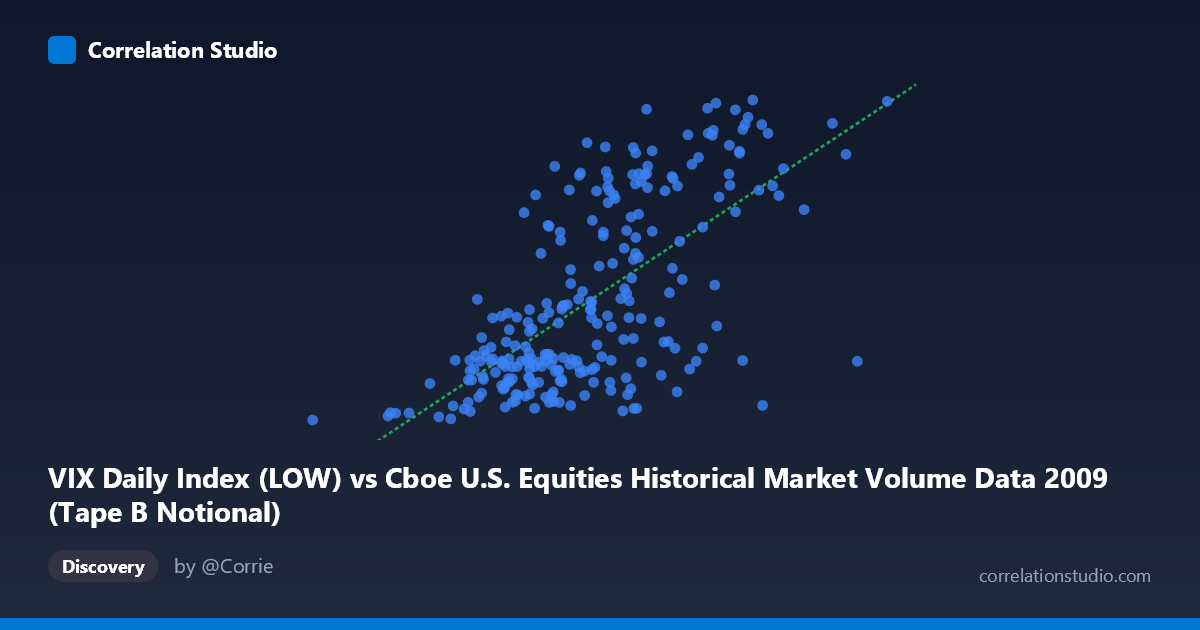
VIX Daily Index (LOW) vs Cboe U.S. Equities Historical Market Volume Data 2009 (Tape B Notional)
- Pearson correlation (r)
- 0.6628
- Spearman correlation
- 0.6443
- p-value
- 0
- Sample size (n)
- 252
- 95% confidence interval
- 0.5873 to 0.7268
- Granger causality
- None
- Granger optimal lag
- 1
AI analysis
Scatterplot Analysis: VIX Tape B Notional vs. Cboe Market Volume (VIX Low)
Overall Relationship The scatterplot reveals a moderate-to-strong positive relationship between the Cboe U.S. Equities Historical Market Volume (VIX Daily Low) on the X-axis and the VIX Tape B Notional values on the Y-axis. As market volume increases, VIX-related notional values tend to rise correspondingly, which is conceptually intuitive: higher trading volume in equity markets is often associated with elevated volatility conditions, and the VIX — as a measure of expected volatility — tends to climb during periods of increased market activity. The linear regression equation (y = 4.358E-9x + 7.489) confirms a positive slope, though the relatively small coefficient reflects the vast scale difference between the two variables.
Correlation Strength and Statistical Significance With r = 0.6628, the correlation is statistically meaningful and directionally clear, but far from deterministic. The r² of 0.4393 is the critical framing metric here: only 43.9% of the variance in Y is explained by X, meaning the majority of variation in VIX Tape B Notional remains unexplained by market volume alone. The 95% confidence interval of [0.5873, 0.7268] is reasonably tight, suggesting stable estimation given the sample of n = 252, and the p-value of effectively zero confirms this relationship is not a statistical artifact. However, the Granger causality results are notably inconclusive — neither direction (X→Y: F = 0.1003, p = 0.7518; Y→X: F = 0.4002, p = 0.5276) achieves significance. This is an important caveat: despite a meaningful contemporaneous correlation, neither variable temporally predicts the other with any reliability at a 1-period lag, suggesting the relationship is better characterized as co-movement driven by shared underlying forces rather than a directional cause-and-effect dynamic.
Patterns, Clusters, and Outliers The data exhibits a notable bimodal or two-cluster structure visible in the sample points. There appears to be a lower cluster concentrated roughly between X values of 1.3B–5.5B with Y values in the 19–30 range, and a second, more dispersed upper cluster at higher X values (5.5B–9.5B) with Y values stretching from 20 to nearly 50. This bifurcation suggests the relationship may not be purely linear — the spread in Y values widens considerably at higher volume levels, indicating possible heteroscedasticity. Several notable outliers appear at the upper extremes: points like (8,730,419,234, 47.08), (7,526,902,255, 47.65), and (7,068,706,762, 48.97) represent high-volume, high-volatility days that likely correspond to specific market stress events during 2009 — a year defined by the aftermath of the 2008 financial crisis and the subsequent recovery rally.
Confounding Factors and Caveats Several important caveats temper interpretation. First, 2009 was an extraordinary market year, encompassing the March 2009 market bottom, extraordinary Federal Reserve interventions, and the beginning of a historic bull market recovery — these structural breaks may artificially inflate correlation by compressing two distinct market regimes into one dataset. Second, the axis label mismatch (VIX Low as X-axis source from a volume dataset, and Tape B Notional from a VIX dataset) warrants scrutiny; this may reflect a data joining artifact where columns were sourced from cross-referenced datasets, making causal inference especially unreliable. Third, volume and volatility indices are both endogenous to the same latent variable — market stress or investor sentiment — meaning any observed correlation likely reflects this common driver rather than a direct relationship between the two measured series. The failure of Granger causality reinforces this interpretation.
Actionable Insights and Further Investigation Given the 56% unexplained variance and absence of Granger causality, practitioners should be cautious about using market volume as a standalone predictor of VIX-derived notional activity. Several avenues merit further exploration: (1) Segment the analysis by market regime (pre- and post-March 2009 bottom) to test whether the correlation is regime-dependent; (2) Introduce a latent variable model incorporating investor sentiment, options open interest, or credit spreads to better account for the shared driver; (3) Test longer Granger lags (beyond 1 period) given that volatility feedback effects sometimes manifest over multi-day windows; and (4) Examine whether the heteroscedastic pattern justifies a log-transformed or nonlinear regression model, which may improve explanatory power and reveal more nuanced dynamics within the two apparent data clusters.
X dataset: Cboe U.S. Equities Historical Market Volume Data 2009
Y dataset: VIX Daily Index
Part of experiment: Daily - Cboe U.S. Equities Historical Market Volume Data 2009 vs VIX Daily Index