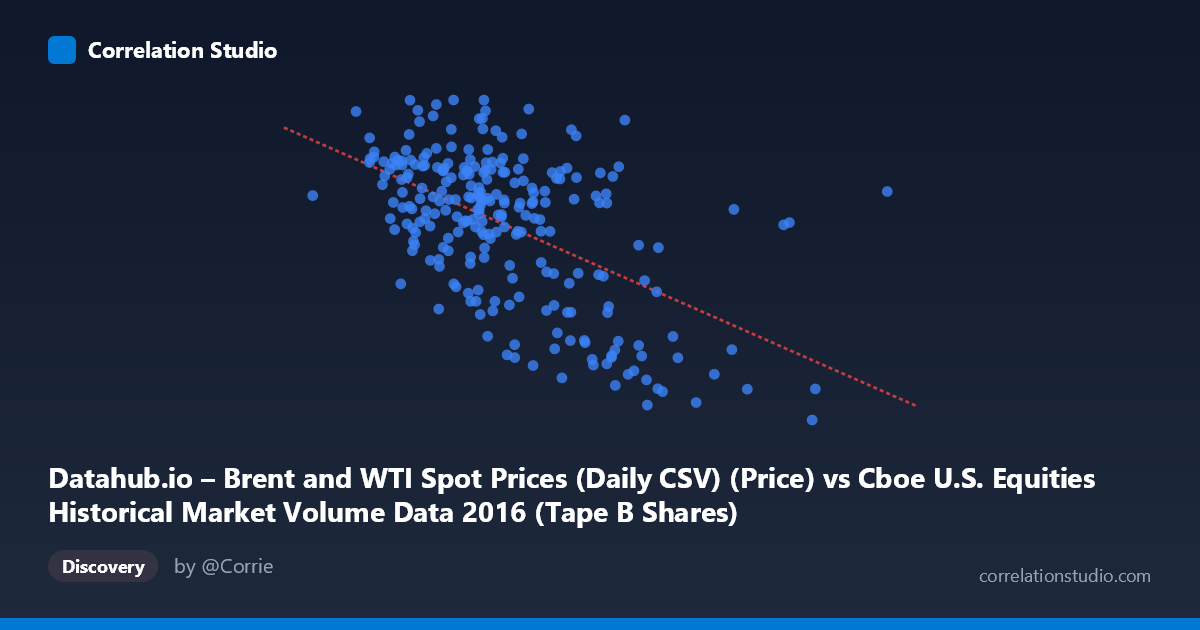
Datahub.io – Brent and WTI Spot Prices (Daily CSV) (Price) vs Cboe U.S. Equities Historical Market Volume Data 2016 (Tape B Shares)
- Pearson correlation (r)
- -0.5451
- Spearman correlation
- -0.4808
- p-value
- 0
- Sample size (n)
- 251
- 95% confidence interval
- -0.6266 to -0.4517
- Granger causality
- None
- Granger optimal lag
- 1
AI analysis
Analysis: Brent Oil Spot Price vs. Cboe Tape B Equity Share Volume (2016)
Relationship Overview The scatterplot reveals a moderate negative relationship between U.S. equity market volume (Tape B shares, X-axis) and Brent crude oil spot prices (Y-axis) across 251 trading days in 2016. As equity trading volume increases, oil prices tend to decrease, and vice versa. The linear regression equation (y = -1.20262E-07x + 56.57) confirms this inverse slope, suggesting that for every ~8.3 billion additional shares traded, Brent prices decline by approximately $1/barrel. Visually, the data cloud tilts downward from left to right, though with considerable scatter around the trend line, indicating the relationship is real but far from deterministic.
Correlation Strength and Statistical Significance The correlation coefficient of r = -0.5451 indicates a moderate negative association. However, the r² of 0.2971 means only ~30% of the variance in Brent oil prices is explained by equity trading volume — leaving 70% attributable to other forces. The 95% confidence interval of [-0.6266, -0.4517] is entirely negative and relatively tight, reinforcing that the negative direction is reliable. With a p-value effectively at zero across N = 3,622 population observations, the result is statistically robust. Critically, however, Granger causality tests find no significant predictive direction in either direction (X→Y: F = 0.79, p = 0.38; Y→X: F = 1.31, p = 0.25), meaning neither variable meaningfully predicts the other's future values at a one-period lag. This decouples statistical correlation from temporal causation entirely.
Notable Patterns and Outliers Several features stand out in the data. A distinct upper-right cluster of moderate-to-high volume days with mid-range oil prices (~44–50 $/barrel) forms the bulk of the distribution, suggesting a "normal market" regime. More striking are the lower-right outliers: points like (209M shares, $26.01) and (170M shares, $27.59) represent days of extreme volume coinciding with very depressed oil prices — consistent with the oil price trough of early 2016. Conversely, lower-volume days (60–80M shares) tend to cluster at higher oil prices (~47–54 $/barrel), reinforcing the inverse pattern. A few high-price/high-volume anomalies (e.g., ~$53 at ~79M shares) suggest the relationship is not monotonic throughout the year.
Confounding Factors and Caveats This correlation almost certainly reflects shared temporal dynamics rather than a direct causal mechanism. Both variables were influenced heavily by the macro environment of 2016: oil prices were recovering from a historic crash in early 2016, while equity market volatility (and thus volume) was elevated during that same stressed period. Market-wide risk-off episodes drive volume up and commodities down simultaneously, creating a spurious negative correlation. Additionally, Tape B specifically covers NYSE American and regional exchanges, which may not perfectly represent broad market sentiment. The dataset covers only a single calendar year, limiting generalizability, and the lack of Granger causality at lag-1 suggests any shared signal is contemporaneous rather than leading/lagging.
Actionable Insights and Further Investigation Analysts should not use volume as a predictor of oil prices or vice versa given the failed Granger tests. However, the shared variance (~30%) warrants exploration of common drivers: VIX (volatility index), Federal Reserve policy announcements, or OPEC output decisions in 2016 could explain both variables simultaneously and should be tested as mediating factors. A regime-based analysis separating the January–February 2016 oil crash period from the recovery phase (H2 2016) would clarify whether the correlation holds across regimes or is driven predominantly by those extreme early-year observations. Extending the time series beyond 2016 would also test whether this relationship is structural or coincidental to a single anomalous year in energy markets.
X dataset: Cboe U.S. Equities Historical Market Volume Data 2016
Y dataset: Datahub.io – Brent and WTI Spot Prices (Daily CSV)
Part of experiment: Daily - Cboe U.S. Equities Historical Market Volume Data 2016 vs Datahub.io – Brent and WTI Spot Prices (Daily CSV)