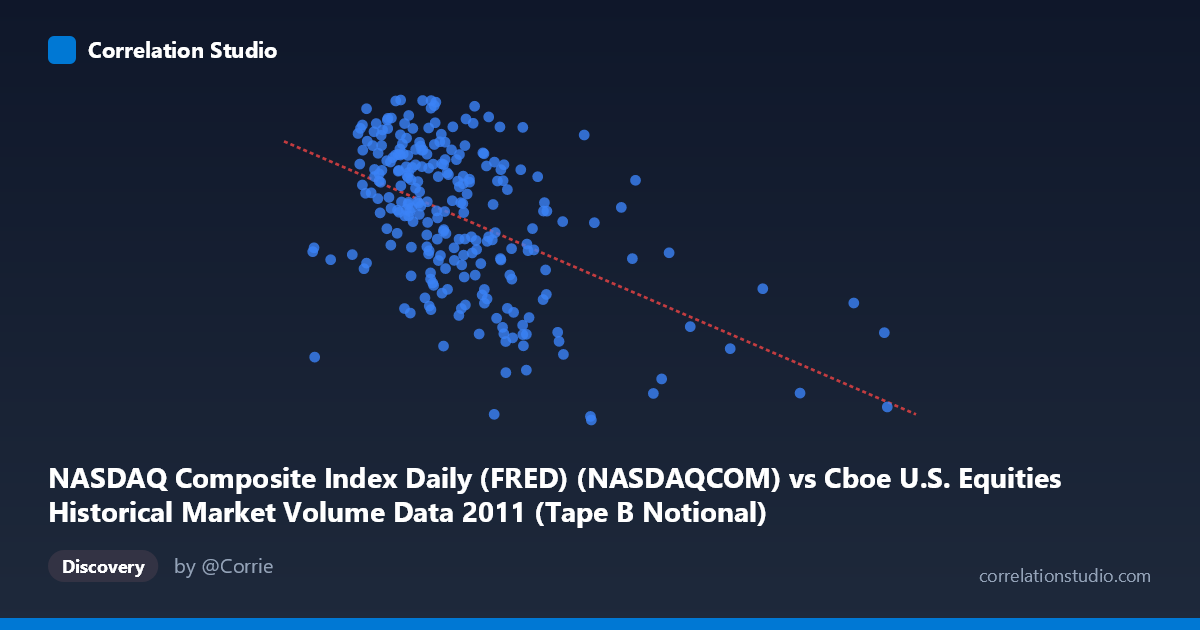
NASDAQ Composite Index Daily (FRED) (NASDAQCOM) vs Cboe U.S. Equities Historical Market Volume Data 2011 (Tape B Notional)
- Pearson correlation (r)
- -0.5066
- Spearman correlation
- -0.47
- p-value
- 0
- Sample size (n)
- 252
- 95% confidence interval
- -0.593 to -0.4086
- Granger causality
- X → Y
- Granger optimal lag
- 10
AI analysis
Scatterplot Analysis: NASDAQ Composite vs. Cboe Tape B Notional Volume (2011)
Relationship Overview
The scatterplot reveals a moderate negative relationship between the NASDAQ Composite Index daily closing value (X-axis) and Cboe U.S. Equities Tape B notional trading volume (Y-axis) across the 2011 trading year. The regression line (y = -3.47×10⁻⁸x + 2854.99) slopes downward from left to right, indicating that on days when the NASDAQ index registered higher values, Tape B notional volume tended to be lower, and vice versa. This inverse pattern is visually apparent in the clustering of higher Y values toward the lower end of the X range (roughly 3–5 billion), contrasted with a drift toward lower Y values as X extends beyond 6–8 billion. The relationship, while discernible, carries substantial scatter throughout the plot, which immediately signals that index level alone is far from a complete predictor of notional volume activity.
Correlation Strength, Direction, and Causality
The Pearson correlation of r = -0.5066 confirms a moderate negative association, but the explanatory power is modest: R² = 0.257, meaning the NASDAQ index level accounts for only about 25.7% of the variance in Tape B notional volume. The remaining ~74% is driven by factors not captured in this bivariate model. The 95% confidence interval of [-0.593, -0.409] is relatively narrow and does not approach zero, and the p-value of effectively 0 (at N = 3,780) confirms the correlation is highly statistically significant — this is not a chance finding. Critically, the Granger causality analysis points unidirectionally: X Granger-causes Y (F = 2.23, p = 0.017) at an optimal lag of 10 trading periods (~2 weeks), while the reverse direction fails to reach significance (F = 0.649, p = 0.771). This suggests that NASDAQ index levels carry meaningful forward-looking information about notional volume activity, but volume does not symmetrically predict index levels — an important asymmetry for practitioners monitoring market microstructure.
Notable Patterns, Clusters, and Outliers
Several structural features stand out in the sample data. The bulk of observations cluster in the X range of roughly 3–6 billion, where Y values span a wide band from approximately 2,415 to 2,875 — indicating high variability in notional volume even when the index is at similar levels. There are notable right-tail outliers in X (e.g., points near 9.5B, 9.96B, and 14.1B from the full range), which correspond to markedly lower Y values, consistent with the negative trend and suggesting that extreme high-volume or high-index days compress notional Tape B activity. Conversely, several low-X observations (around 3.0–3.5B) anchor near the top of the Y range (2,825–2,875), reinforcing the inverse pattern. A potential non-linear feature is also present: the relationship may steepen at the tails, with the middle of the X distribution showing the most scatter, hinting that a simple linear fit may slightly underperform a curved or segmented model.
Confounding Factors and Interpretive Caveats
Several important caveats apply. First, 2011 was an atypical market year — it included the U.S. debt ceiling crisis (August 2011), European sovereign debt contagion fears, and significant volatility spikes, all of which could generate spurious inverse patterns where panic-driven high volume coincides with index drawdowns. Second, the causal framing requires care: Granger causality demonstrates predictive precedence in a statistical sense, not structural economic causation — common macroeconomic shocks could drive both series simultaneously with differential lags. Third, Tape B specifically covers NYSE American (AMEX) and regional exchange-listed securities, not the full NASDAQ universe, so comparing NASDAQ index levels to Tape B volume introduces a cross-venue measurement mismatch. Fourth, notional volume is sensitive to price levels themselves, creating a potential endogeneity since higher index prices mechanically inflate notional values per share traded, which could partially suppress or confound the observed negative relationship.
Actionable Insights and Further Investigation
Practitioners should consider the 10-period lag finding actionable: a meaningful decline in the NASDAQ index today may signal elevated Tape B notional activity roughly two weeks forward, which could inform liquidity planning, execution scheduling, or risk hedging windows. To deepen this analysis, it would be valuable to: (1) decompose the relationship by market regime (pre- vs. post-August 2011 volatility shock) to test whether the correlation is driven primarily by the crisis period; (2) normalize notional volume by index price level to disentangle mechanical price-size effects; (3) test additional Tape designations (Tape A for NYSE, Tape C for NASDAQ-listed) to assess whether the inverse pattern is venue-specific or market-wide; and (4) extend the Granger analysis across multiple years to determine whether the 10-period lag structure is stable or an artifact of 2011's unusual macro environment. A regime-switching or quantile regression model could also better capture the apparent heteroscedasticity visible across the X range.
X dataset: Cboe U.S. Equities Historical Market Volume Data 2011
Y dataset: NASDAQ Composite Index Daily (FRED)
Part of experiment: Daily - Cboe U.S. Equities Historical Market Volume Data 2011 vs NASDAQ Composite Index Daily (FRED)