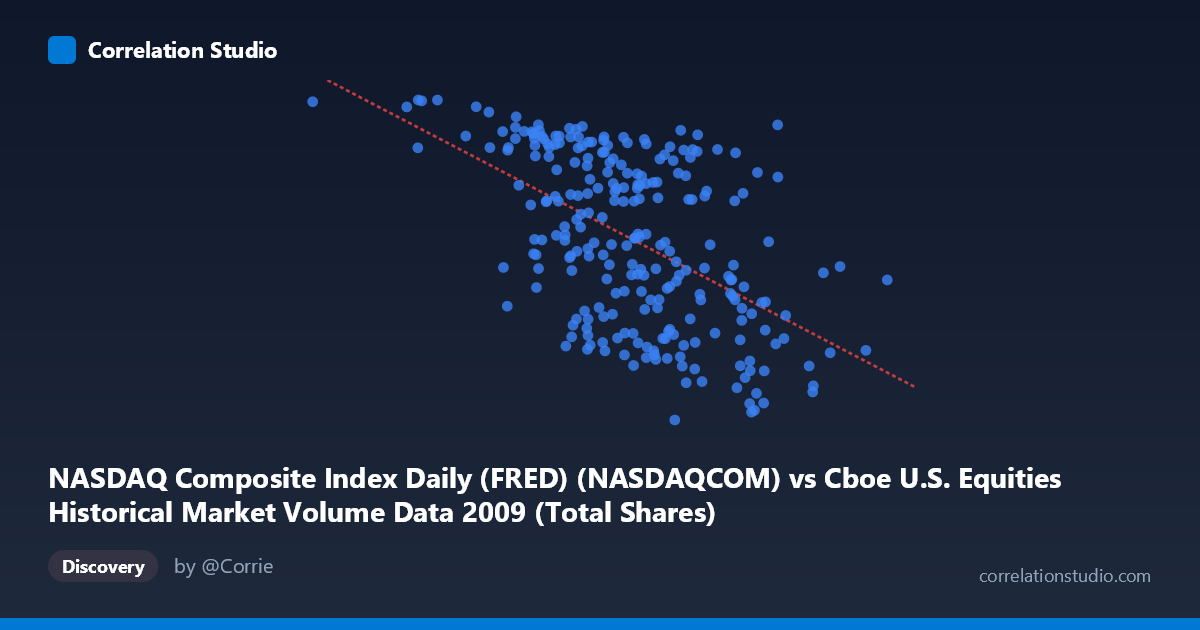
NASDAQ Composite Index Daily (FRED) (NASDAQCOM) vs Cboe U.S. Equities Historical Market Volume Data 2009 (Total Shares)
- Pearson correlation (r)
- -0.541
- Spearman correlation
- -0.5372
- p-value
- 0
- Sample size (n)
- 252
- 95% confidence interval
- -0.6229 to -0.4473
- Granger causality
- X → Y
- Granger optimal lag
- 10
AI analysis
Analysis: NASDAQ Composite Index vs. Cboe U.S. Equities Total Shares Volume (2009)
Relationship Overview
The scatterplot reveals a moderate negative relationship between the NASDAQ Composite Index daily closing value and total shares volume traded on U.S. equities exchanges throughout 2009. As the NASDAQ index climbed from its crisis-era lows (around 1,268) toward recovery levels (approaching 2,291), trading volume generally declined — a pattern consistent with the well-documented "wall of worry" dynamic where markets rise on diminishing volume as panic-driven selling subsides. The linear regression equation (y = -9.40×10⁻⁷x + 2,559.93) confirms this inverse trajectory, though the relationship is far from deterministic.
Correlation Strength and Statistical Significance
The Pearson correlation of r = -0.541 indicates a moderate negative association, but the explanatory power deserves careful framing: r² = 0.293, meaning the NASDAQ index level accounts for only about 29.3% of the variance in daily share volume. Roughly 70% of volume variation is driven by factors not captured here. The 95% confidence interval of [-0.623, -0.447] is comfortably negative throughout and does not cross zero, and the p-value of effectively zero across a paired sample of n = 252 (drawn from a population of N = 3,232) confirms this is not a chance finding. Critically, Granger causality runs unidirectionally from X→Y (NASDAQ index → share volume; F = 2.025, p = 0.032) with an optimal lag of 10 trading periods (~2 weeks), while the reverse direction fails significance (Y→X: p = 0.096). This suggests that index price levels have modest but statistically meaningful predictive power over future volume, not the reverse — consistent with behavioral finance theories where sustained price appreciation reduces urgency-driven trading activity.
Notable Patterns, Clusters, and Outliers
Several features stand out in the sample data. There is a visible high-volume cluster at lower index values (roughly 1,268–1,600 on Y, corresponding to X values concentrated between 500M–750M shares), reflecting the volatile early-2009 bear market bottom period when panic selling and capitulation drove extreme activity. Conversely, as the index recovered above 2,000, volume observations thin out and shift toward lower share counts. Several outliers warrant attention: the point near (192,269,942, 2,285) represents an anomalously low-volume day at a high index level, while points near (1,212,524,830, 1,716) and (1,081,222,240, 1,377) show very high volume at relatively modest index levels, suggesting episodic institutional activity or event-driven spikes that deviate from the trend. The data does not appear strictly linear — there are hints of heteroscedasticity, with wider volume dispersion at intermediate index levels.
Confounding Factors and Interpretive Caveats
Several important caveats apply. Temporal autocorrelation is almost certainly present in both daily index values and volume series, which can inflate apparent correlation significance. The 2009 timeframe is highly unusual — the global financial crisis recovery creates a regime-specific relationship that may not generalize to other periods; volume-price dynamics in crisis-to-recovery transitions are structurally different from normal market conditions. Additionally, total shares volume aggregates all U.S. equity exchanges, while the NASDAQ index reflects only NASDAQ-listed stocks, introducing a conceptual mismatch. Options expiration dates, Federal Reserve announcements, earnings seasons, and index rebalancing events all produce volume spikes independent of price level, acting as unobserved confounders. The 10-day Granger lag also warrants caution — this optimal lag was data-selected and may reflect overfitting rather than a true structural mechanism.
Actionable Insights and Further Investigation
Practitioners monitoring market microstructure should treat sustained volume expansion during a rally as a meaningful signal — its absence (as seen here) historically suggests fragile recoveries vulnerable to reversal. For further investigation, several avenues are promising: (1) decompose volume by exchange to isolate whether the NASDAQ-specific volume mirrors this relationship more cleanly; (2) control for VIX as a volatility proxy to assess whether the price-volume relationship persists after accounting for fear/uncertainty; (3) test whether the 10-period Granger lag holds out-of-sample in subsequent years (2010–2011) to validate predictive utility; and (4) apply a rolling correlation analysis to detect whether the negative relationship strengthened or reversed across different 2009 sub-periods (Q1 crisis bottom vs. Q2–Q4 recovery), which would better characterize this regime-dependent dynamic.
X dataset: Cboe U.S. Equities Historical Market Volume Data 2009
Y dataset: NASDAQ Composite Index Daily (FRED)
Part of experiment: Daily - Cboe U.S. Equities Historical Market Volume Data 2009 vs NASDAQ Composite Index Daily (FRED)